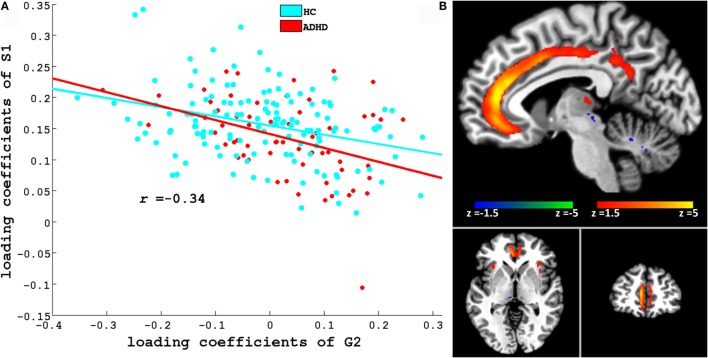
Figure 3.
(A) Scatter plots of loading coefficient of brain phenotype component S1 and genetic component G2. Scatter plot and line in red and cyan color indicates ADHD and HC group, respectively. (B) Significant regions in S1. Brain slices shown in the above figure are x = −6, y = 46, and z = −3 in Montreal Neurological Institute (MNI) space.

