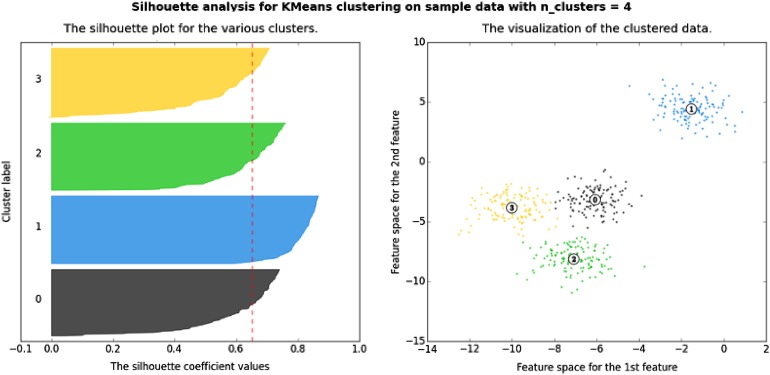
Fig. 2.
A silhouette plot used for non-hierarchical clustering (k-means) (from [20], with permission). A silhouette plot shows how close observations from neighbouring clusters are to each other using a measure of −1 to +1. A value of +1 indicates that observations are far away, 0 indicates that the observations are very close to the boundary of deciding exactly which cluster they belong to, and −1 indicates that the observations may be assigned to the wrong cluster

