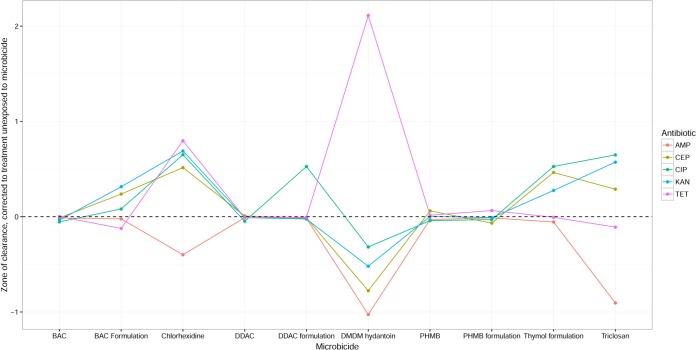
FIG 1.
Antibiotic susceptibility of strains adapted to different microbicides. The values plotted are the differences in the average zone of clearance across strains before and after adaptation to the given microbicide, as estimated by the linear mixed-effects model (arbitrary scale; see Materials and Methods); i.e., values above 0 indicate antibiotic cross-susceptibility arising from adaptation to the microbicide, and values below 0 indicate cross-resistance. Points are connected for ease of comparison only. For abbreviations on the x axis, see footnote a to Table 1. AMP, ampicillin; CEP, cephalothin; CIP, ciprofloxacin; KAN, kanamycin; TET, tetracycline.

