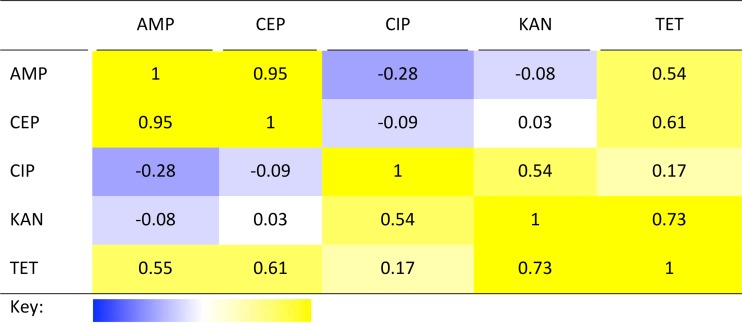
TABLE 2.
Correlation of responses to different antibiotics across strains in LMMa
A value of 1 (deep yellow in the key) indicates that all organisms responded in a perfectly correlated way to the two antibiotics indicated (they were either more or less sensitive to both); a value of −1 (deep blue in the key) indicates a perfect negative correlation, i.e., organisms that are more sensitive to one antibiotic being less sensitive to the other and vice versa. For abbreviations, see the legend to Fig. 1.

