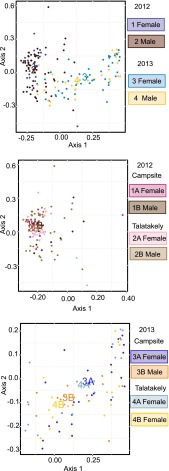
FIG 3.
Visualization of the analysis of multivariate homogeneity of group dispersions based on Yue-Clayton dissimilarity metrics. There is a clear difference between years, whereas within-year groups overlap extensively. The between-group variation is smaller in 2012, as the group centroids are more spread apart in 2013.

