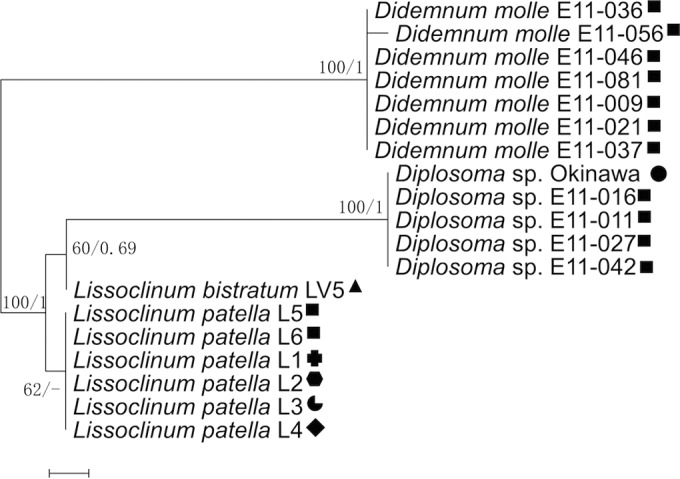
FIG 3.

Maximum-likelihood (ML) tree from analysis of the Prochloron psbU gene. The trees were generated by MEGA, version 7.0. Shapes indicate collection location as defined in Fig. 1C. Maximum-likelihood bootstrap values and Bayesian clade credibility values are indicated at the nodes (bootstrap values/clade credibility values).
