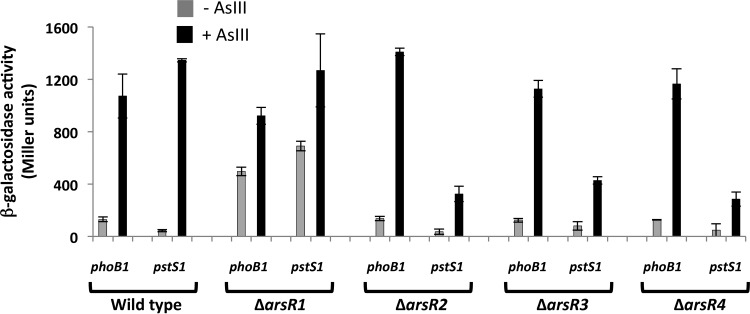
FIG 6.
Comparison of levels of regulatory control of phoB1 and pstS1 in the wild-type and ΔarsR mutant strains. Data are examples from reproducible experiments, with the data representing the means ± ranges (n = 2). Cultures were incubated for 7 h with 50 μM Pi, with (black bars) or without (gray bars) 100 μM As(III).

