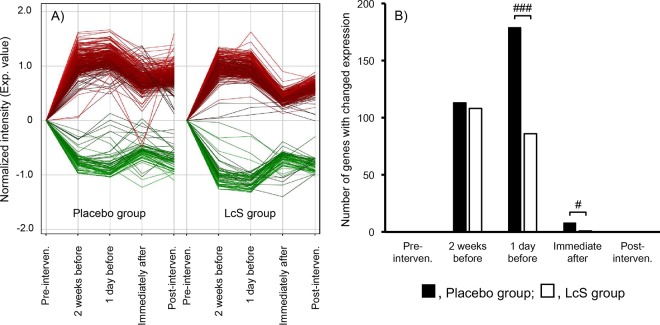
FIG 4.
Effects on the changes of gene expression in peripheral blood leukocytes. Normalized intensity of gene expression changes (A) and the number of genes with a change in expression of more than 2-fold compared with that at baseline (P < 0.05, unpaired Student's t test) (B). Gene expression change in peripheral blood leukocytes was determined by microarray analysis, and 19,194 probes, having fluorescence intensities higher than the cutoff value of 50 among all samples, were analyzed. Data were analyzed by Fisher's exact test. #, P < 0.05; ###, P < 0.001 between the two groups. LcS, L. casei strain Shirota.

