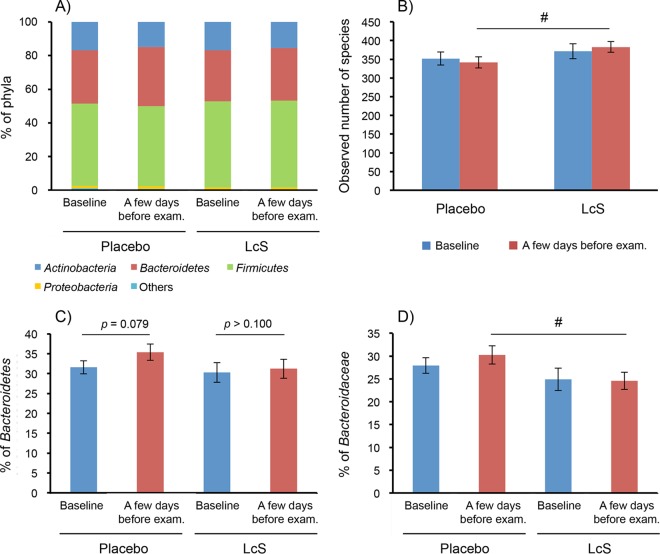
FIG 5.
Effects on the composition of the gut microbiota. Composition of phyla (A), number of observed species (B), percentage of Bacteroidetes in the phyla (C), and percentage of Bacteroidaceae in the families (D). (B to D) Values indicate the means ± SE. Data were analyzed by Wilcoxon's signed-rank test within a group and Mann-Whitney U test between the groups. #, P < 0.05 between the two groups. LcS, L. casei strain Shirota.

