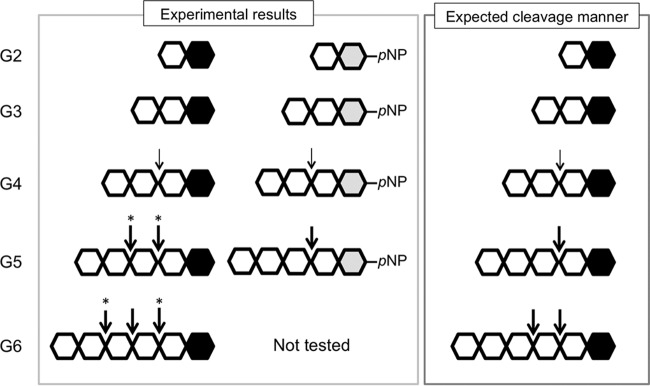
FIG 7.
Schematic illustration of the reaction catalyzed by Tc-ChiD. Individual GlcNAc monomers are represented by hexagons. The black hexagons indicate the reducing ends of the GlcNAc oligomers, and those in the pNP-GlcNAc oligomers are in gray. Thin arrows indicate positions with lower activities. Asterisks indicate cleavage sites that cannot be distinguished in the experiments.

