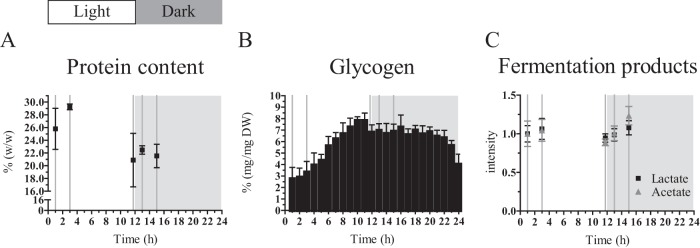
FIG 4.
Cellular composition of a turbidostat-controlled culture treated with a diel light regime of 12 h of light and 12 h of dark. Dashed vertical lines represent the time points of sampling for dry weight, metabolite, protein, and transcript analysis. (A) The protein content of the cells is higher at early time points of the light period compared to the later time point and compared to the samples from the dark period. Values are expressed in percentage of dry weight. Values are the average and standard deviation derived from the biological replicates (n = 2) and two technical replicates (n = 2). Note the split y axis. (B) The glycogen content shows a distinct accumulation and degradation pattern. Values are expressed in percentage of dry weight. Values are the average and standard deviation derived from the biological replicates (n = 2) and two technical replicates (n = 2). (C) Metabolite analysis reveals a constant concentration of intracellular lactate and a slight increase for intracellular acetate in the early dark period. Intensity values are normalized to the value of the first sampling time point in the light period. Mean and standard error of the mean are shown.

