
FIG 2.
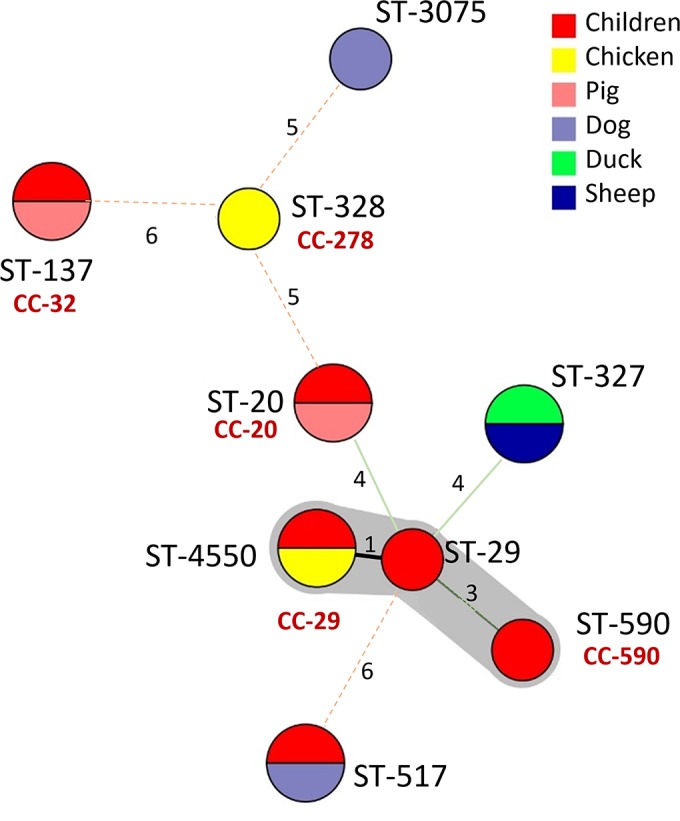
Minimum spanning tree analysis of 14 aEPEC isolates based on MLST profile and according to source (color of the circle indicates the species). Each circle represents the ST, and the size of the circle and circle divisions indicate the number of isolates within any given ST. Lines indicate strength length (distance) symbolized with numbers (number of nonshared alleles) and thickness. The genetic cluster is labeled and represented by the surrounding shading.