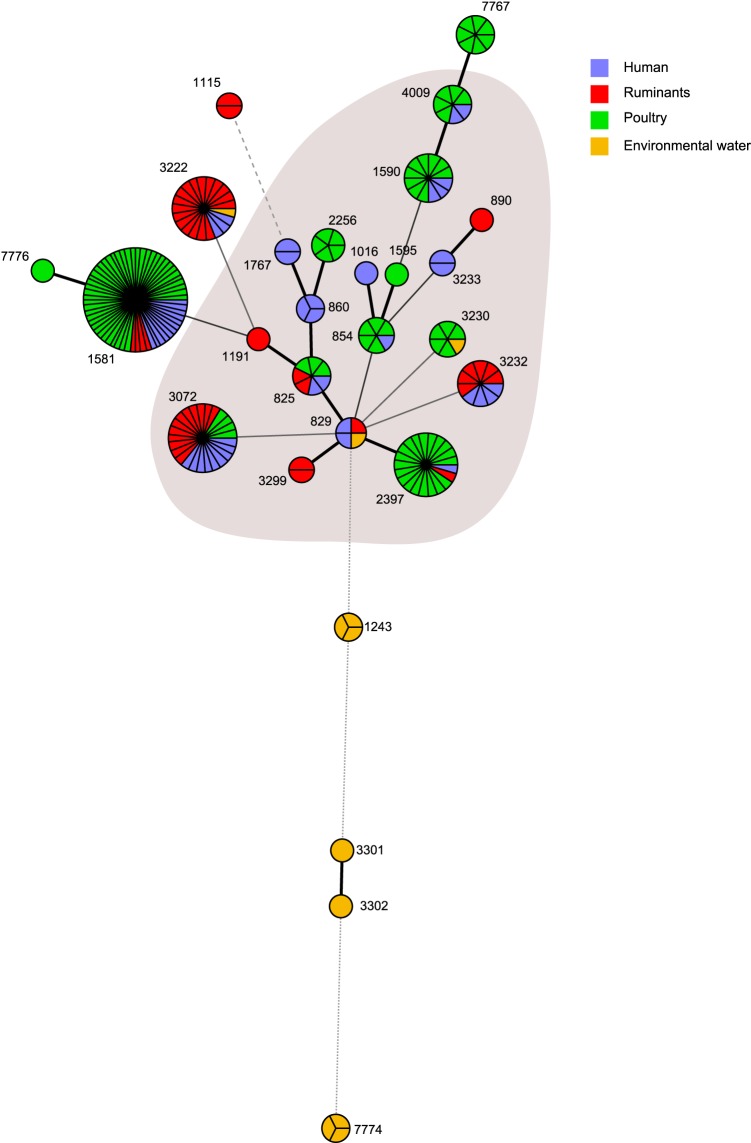
FIG 1.
Minimum spanning tree of C. coli STs from 4 different sources. Each node represents an ST; its size is proportional to the frequency of isolation and the colors represent the different source types. The thickness of the connecting lines is proportional to the similarities between STs, with the thickest connector linking single-locus variants. The shaded area represents members of the ST-828 CC.

