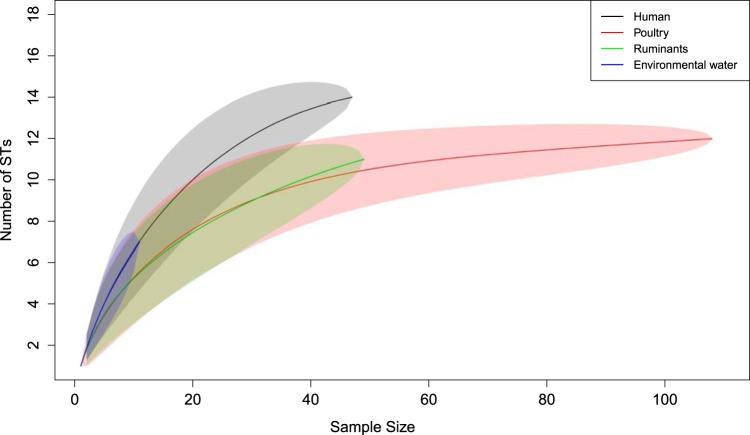
FIG 3.
Rarefaction curves of the human, poultry, ruminant, and environmental water C. coli STs. The shaded areas represent the 95% CrI. Note that the poultry and ruminant upper boundary of the 95% CrI does not reach the point estimate of the human curve at maximum sample size. The environmental water curve overlaps the human curve.

