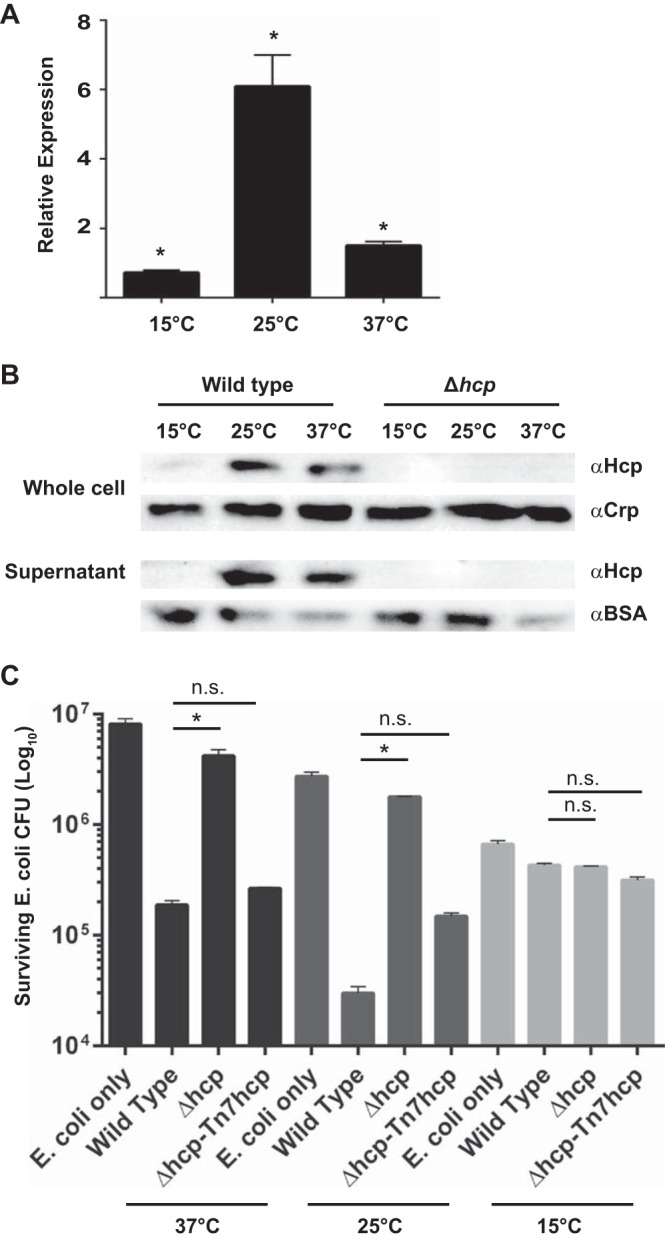
FIG 3.

The T6SS is modulated by temperature. (A) Analysis of hcp gene expression by qRT-PCR. Error bars indicate standard deviations of the results from three biological replicates (P < 0.05). (B) Hcp production levels by Western blot analysis before (at 37°C) and 1 h after (15°C or 25°C) a low-temperature shift. BSA, bovine serum albumin control; α, anti. (C) T6SS-mediated killing of E. coli at 37°C, 25°C, and 15°C. Error bars indicate standard deviations of the results from three biological replicates. *, P < 0.05; n.s., not significantly different (P > 0.05).
