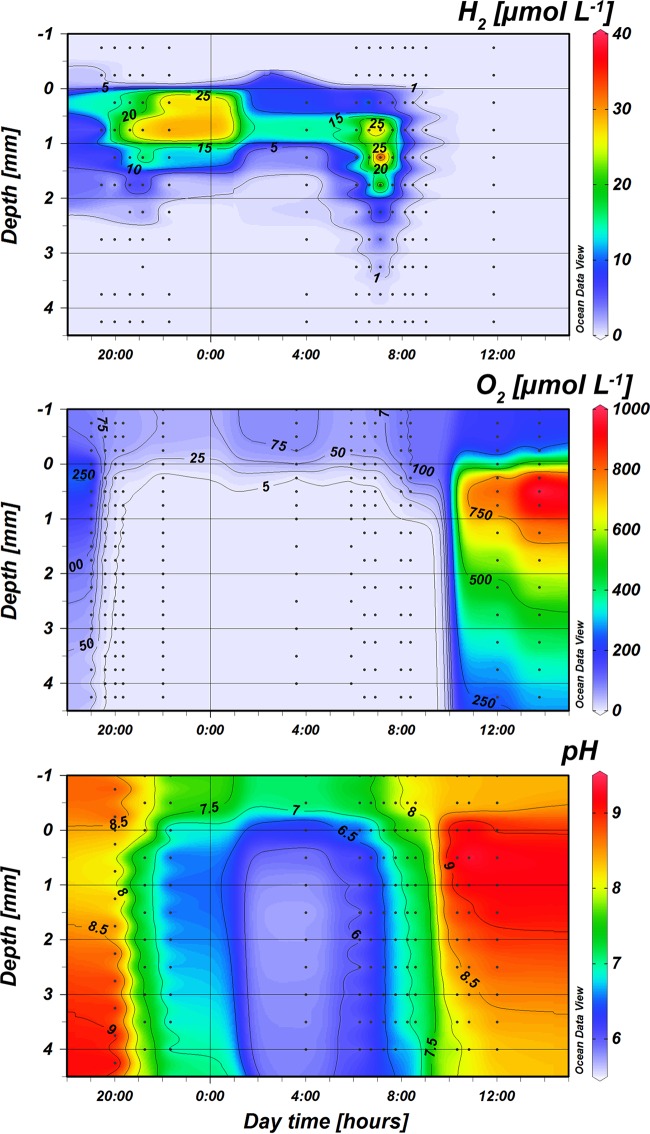
FIG 3.
Isopleths of O2, pH, and H2 depth distribution over a diel cycle in the 58°C Mushroom Spring mat. The measured profiles on which the interpolations were based are shown as dots. The last O2 profile in the morning was recorded at 8:22 when the first peak of O2 was recorded, the upper 1 mm of the mat became oxic, and H2 became nondetectable. Notice that the interpolation for H2 between about 23:00 and 3:00 is uncertain due to a lack of measuring points during this time interval.

