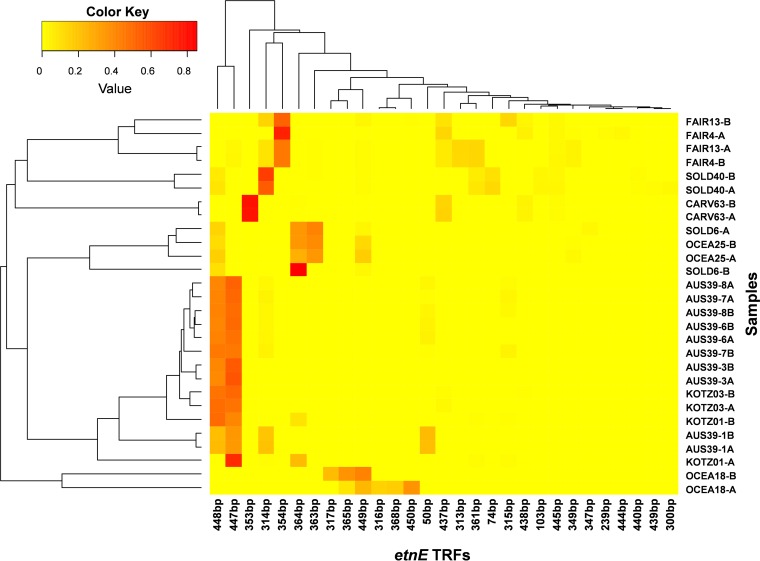
FIG 1.
Clustered heatmap of T-RFLP profiles generated by AcoI (EaeI) restriction-digested partial EaCoMT genes. For clarity, T-RFs with relative abundance of <1% were excluded from the graph. The higher the relative abundance of a particular T-RF in the sample, the warmer the coloring. Sample identifiers are formatted by site (using the first four characters of the name of each site), well number, and replicate (A or B). Please see Table 1 for specific site names.

