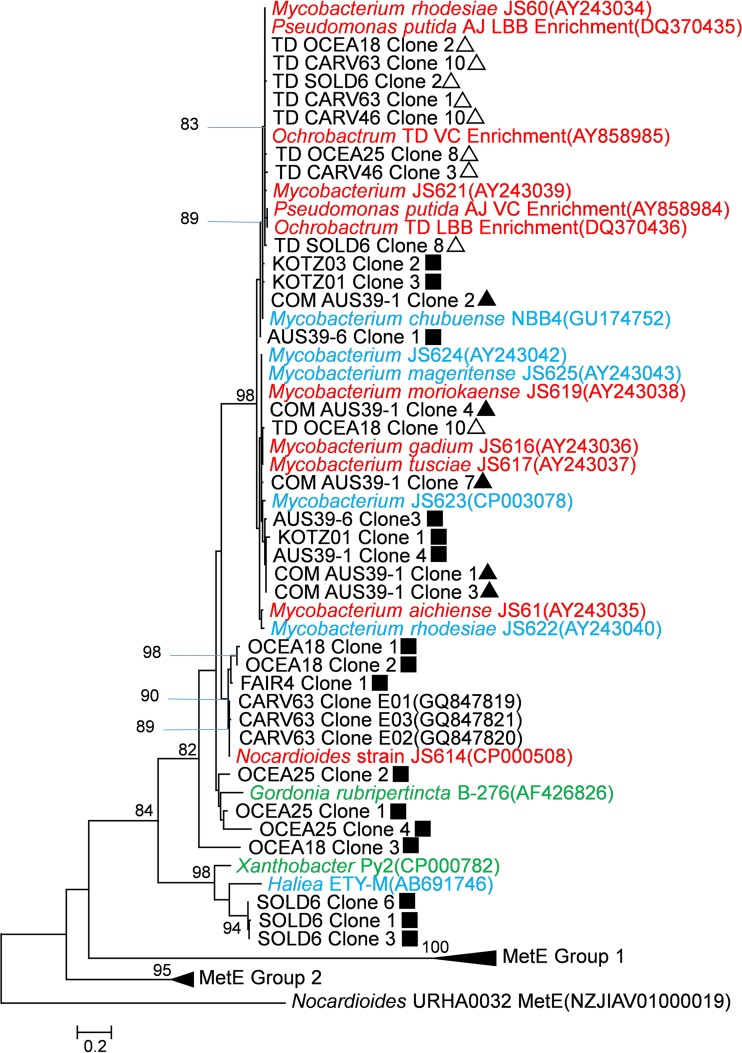
FIG 2.
A phylogenetic tree depicting the relationship of deduced EtnE amino acid sequences from environmental samples, enrichment cultures, and isolates (see Table S6 in the supplemental material), along with MetE sequences from related strains (see Table S7 in the supplemental material). Isolates are color coded as follows: red, VC assimilators; blue, etheneotrophs; green, propene oxidizers. Carver sequences from GenBank were from ethene enrichment cultures (60). Environmental samples are identified as described in Table 1. The symbols refer to the PCR amplification method used: ▲, conventional PCR; ■, nested PCR; △, nested PCR with a touchdown modification. Amino acid sequences were deduced from partial EaCoMT sequences (excluding gaps). An alignment of 166 aa (including gaps) was generated in ClustalW (56), and the tree was constructed and visualized in MEGA5 using the maximum likelihood method (57) with the Nocardioides sp. strain URHA0032 MetE gene as the outgroup. The bar represents a 20% sequence difference. For environmental samples, only sequences of <99% identity with other sequences from the same samples were included on the tree. Refer to Fig. S1 in the supplemental material for the complete nucleotide phylogenetic tree generated with all 139 sequences obtained in this study. See Table S8 in the supplemental material for GenBank accession numbers of clone sequences presented in this study.

