
FIGURE 4.
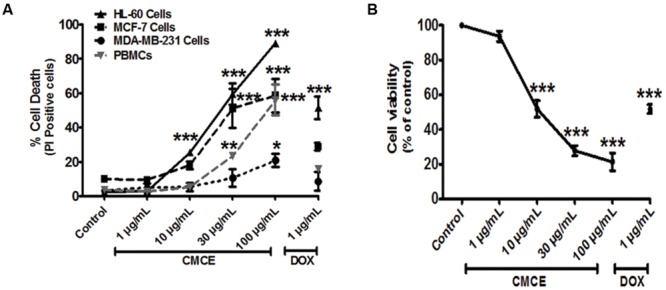
Effects of CMCE on cell viability of HL-60, MCF-7, MDA-MB-231 cells, and PBMCs. The cells were treated with different concentrations of CMCE (1, 10, 30, and 100 μg/mL) or DOX (1 μg/mL) for 20 h and cell viability was determined by (A) PI permeability in HL-60, MCF-7, MDA-MB-231 cells, and PBMCs (B) SRB assay in HL-60 cells. Values represent the mean (at least n = 3) ± SEM; ∗p < 0.05, ∗∗p < 0.01, ∗∗∗p < 0.001 control vs. CMCE or DOX treated cells.