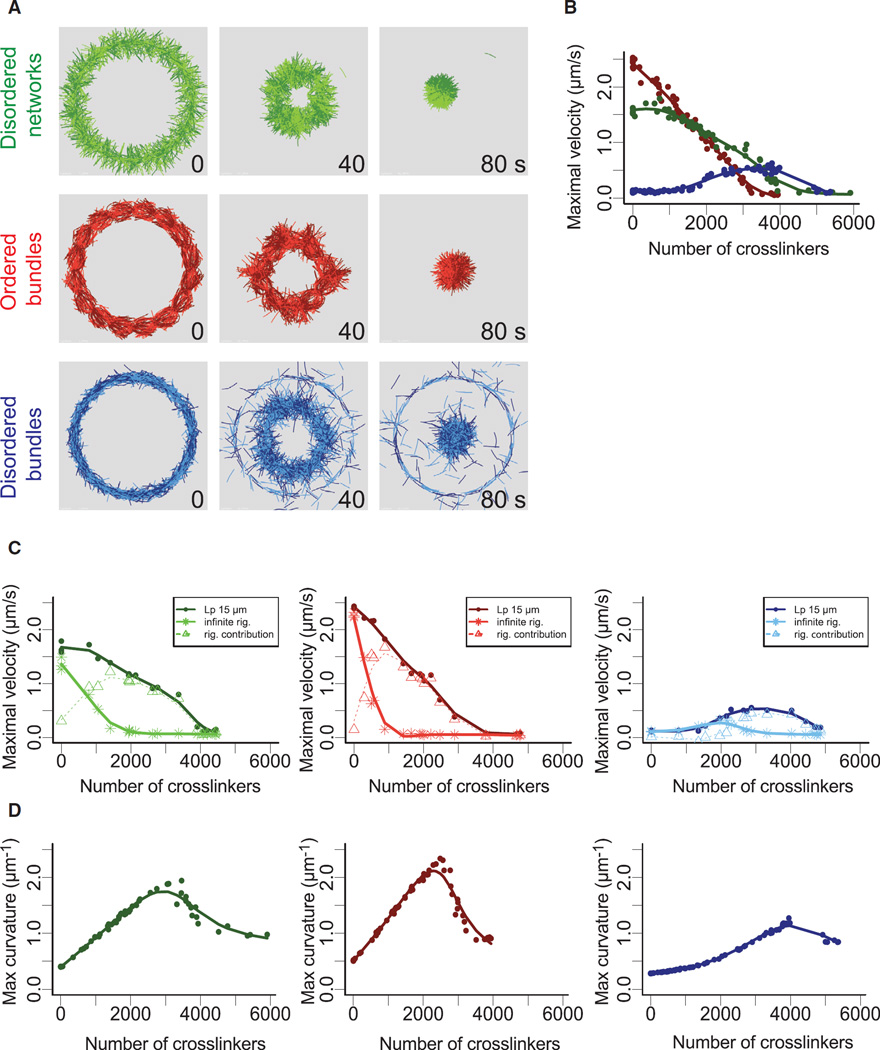
Figure 4. Mechanism of Ring Deformation in Presence of Crosslinkers.
(A) Snapshots of simulated actin rings with different architectures: branched network (green), ordered bundles (red), disordered bundles (blue) in presence of 2,500 crosslinkers representing α-actinin.
(B) Maximal rate of ring perimeter decrease, as a function of the number of crosslinkers for each type of ring.
(C) Effect of polymer rigidity on ring deformation. Simulations were performed for two different polymer rigidities (Lp = 15 µm dark curve and ∞ Lp light curve) for the different types of actin architecture as indicated in the different panels. The dashed curves correspond at the difference between the curves for Lp = 15 µm and infinite Lp, respectively.
(D) Estimation of maximal actin filaments buckling during ring deformation. The maximal curvature over time was determined according to filaments curvature (inverse of curvature radius) for the entire ring.

