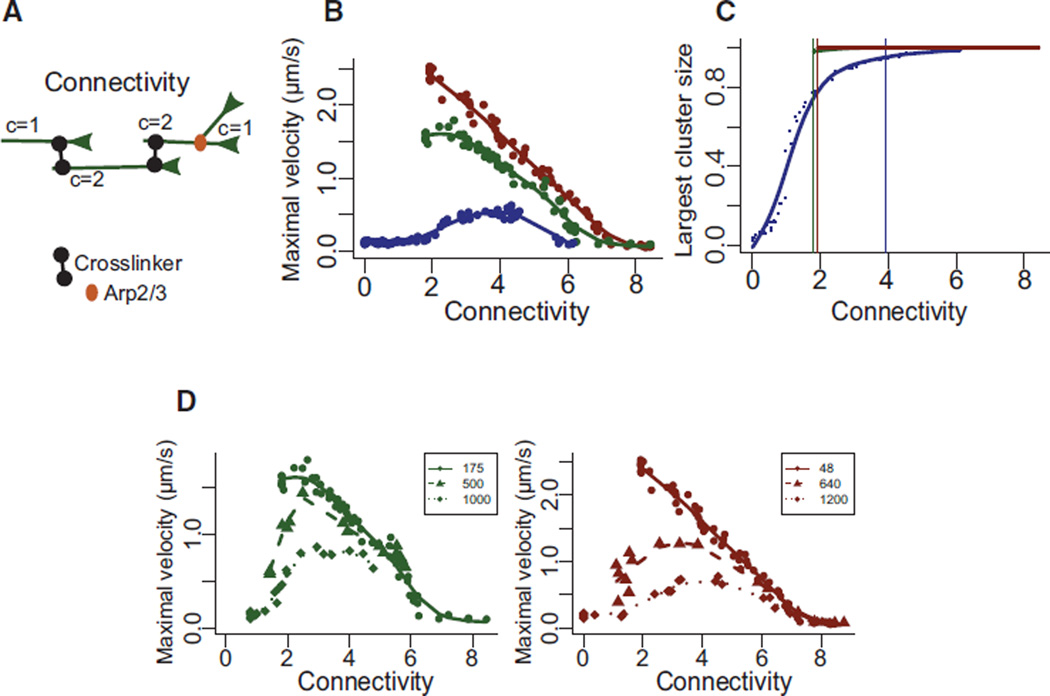
Figure 5. Connectivity Modulates the Contractile Response of Actin Rings.
(A) Schematic illustration (left) of the connectivity C of different actin filament generated by the Arp2/3 complex (red symbols) and α-actinin (black symbols). The network connectivity is the average of all filament connectivity values. It is expected to increase as a function of the number of connecting crosslinkers present in the system (right).
(B) Maximal velocity of perimeter deformation for the different actin rings as a function of the network connectivity.
(C) Size of the largest percolating cluster (normalized to the total number of actin filaments) as a function of the network connectivity, for branched network (green), ordered bundles (red), and disordered bundles (blue). Vertical lines indicate the threshold at which percolation is considered reached (i.e., 95% of filaments are connected).
(D) Variation of the maximal velocity for a define ring architecture (disordered networks green, ordered bundles red) with different initial configuration (variable number of primers for disordered networks green or ordered bundles red, see Experimental Procedures) as a function of the network connectivity.

