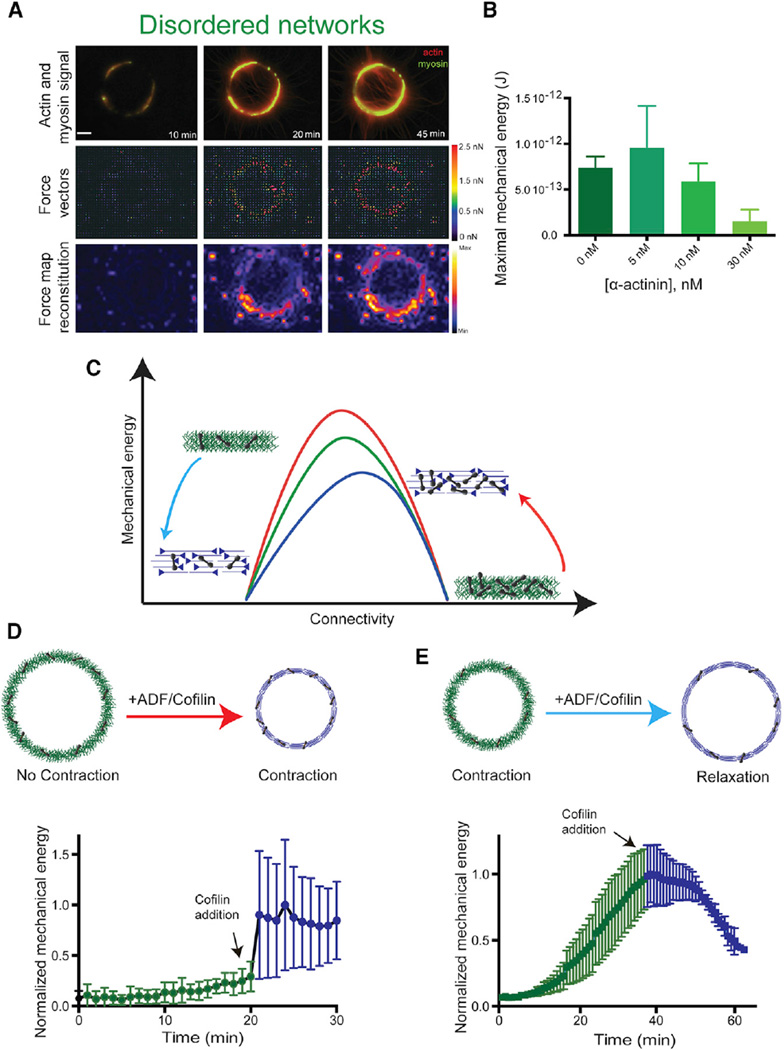
Figure 6. Dynamic Variations of Actin Network Connectivity.
(A) Contraction of a branched network ring on a patterned deformable substrate. Combined fluorescence images (top row) show actin and myosin signals, while second and third rows show the corresponding force vectors and the force map reconstitution.
(B) Maximal mechanical energy of the actin disordered branched network, for the indicated α-actinin concentrations. The maximal mechanical energy is defined as the maximal deformation that ring contractions cause on their substrate.
(C) Qualitative contractile behavior for the three different actin rings, as a function of the network connectivity, as predicted by the model (Figure 3D). The red arrow illustrates the effect of reducing connectivity in a highly connected actin network, while the blue arrow indicates a reduction of connectivity in a network with optimal connectivity. The contractility is enhanced in the shift represented by the red arrow, whereas it is reduced in the blue arrow.
(D and E) Cartoon representations (top) of the actin architectures before and after addition of ADF/cofilin and kinetic of the normalized total network mechanical energy as a function of time (bottom). In (D), a highly crosslinked branched actin network (100 nM α-actinin) was de-branched by addition of 100 nM ADF/cofilin. This configuration corresponds to the red arrow. In (E), a network with nearly optimal connectivity (10 nM α-actinin) is debranched by addition of 100 nM ADF/cofilin. This configuration corresponds to the blue arrow. See also Figure S4.

