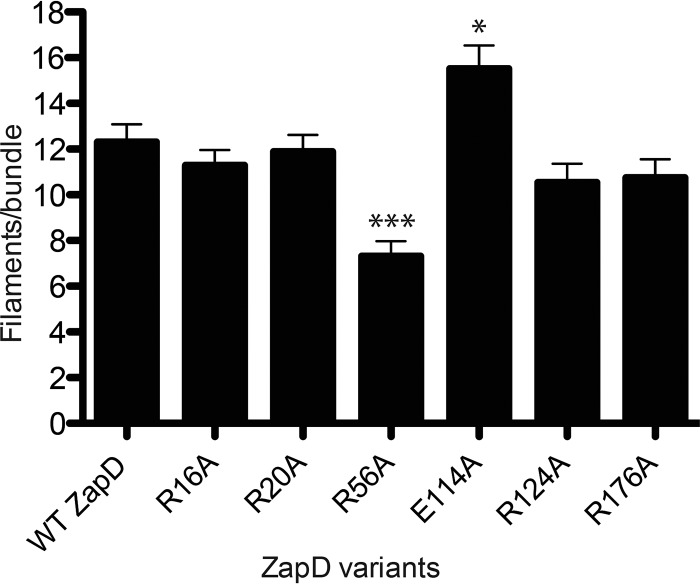
FIG 5.
Quantitative assessment of FtsZ bundles in the presence of WT ZapD and ZapD variants. Shown is a histogram summarizing the mean number of FtsZ filaments per bundle. TEM images were analyzed, and the mean numbers of filaments per bundle ± standard errors were plotted for each ZapD variant. More than 10 fields of view per sample (n = 50 bundles per ZapD variant) were used to calculate means. ***, P < 0.0001; *, P < 0.05 compared to WT ZapD. The mean number of FtsZ filaments per bundle was not enumerated for ZapD R116A, R221A, and R225A, as organized bundles were not observed.

