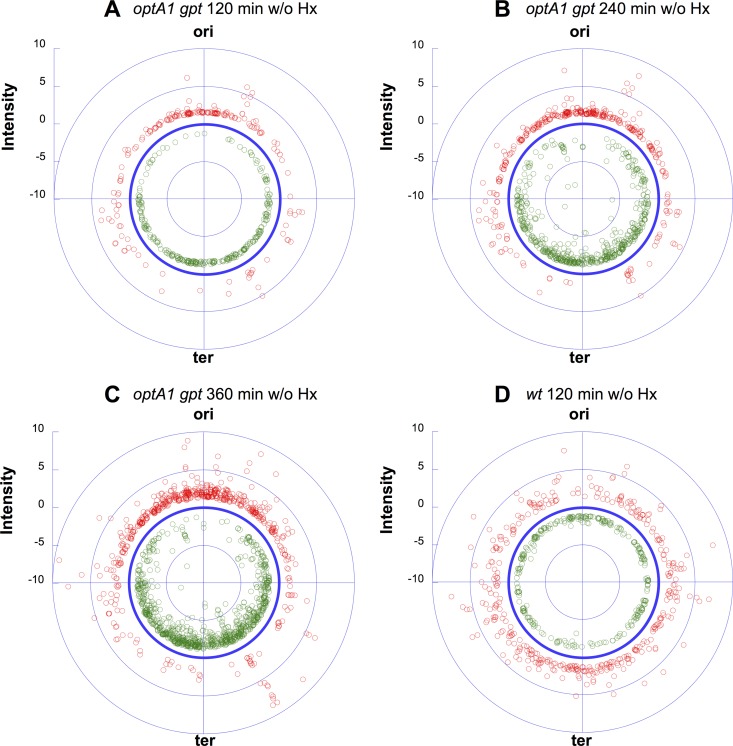
FIG 10.
Diagrams showing the distributions of gene expression ratios (for significantly affected genes) along the E. coli chromosome in the optA1 gpt strain at three different time points (each relative to time zero) during dGTP starvation: 2 h (A), 4 h (B), and 6 h (C). (D) Control results for the wild-type strain cultivated without hypoxanthine for 2 h (low-dilution protocol). ori, E. coli replication origin (84.6 min); ter, chromosomal replication terminus (34.6 min). Red symbols indicate upregulated genes, and green symbols indicate downregulated genes, both relative to the no-effect circle (dark blue).

