
FIG 8.
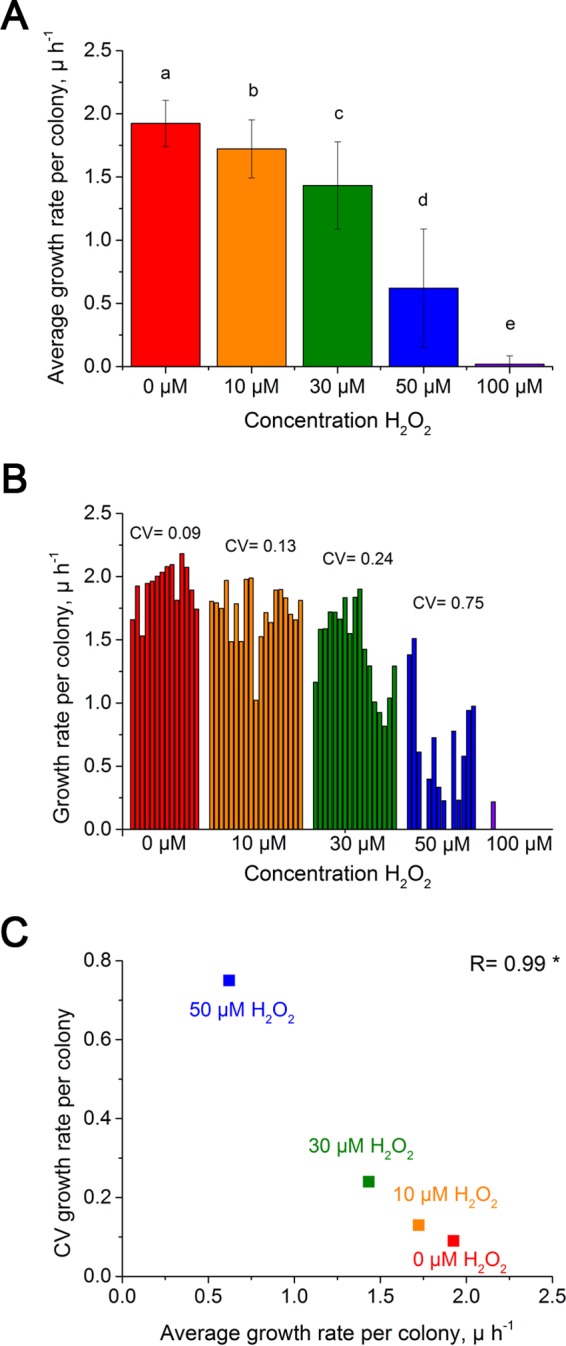
Variation in microcolony growth rate increases at lower growth rates. (A) The average growth rate per microcolony averaged over all cells over all time points for each microcolony for each concentration of H2O2. The error bars represent the standard deviations. The letters represent the statistical significance; samples labeled with different letters are statistically different (ANOVA test, P < 0.05). (B) The average growth rate for each microcolony and the coefficient of variation (CV) of growth rate among microcolonies for each H2O2 concentration. Two of the microcolonies exposed to 50 μM H2O2 and 10 of the microcolonies exposed to 100 μM H2O2 are not visible in the plot because their average growth rate is 0. (C) Scatter plot of the coefficient of variation versus the average growth rate for each concentration of H2O2. R represents the Pearson correlation coefficient. *, P < 0.05.