
FIG 3.
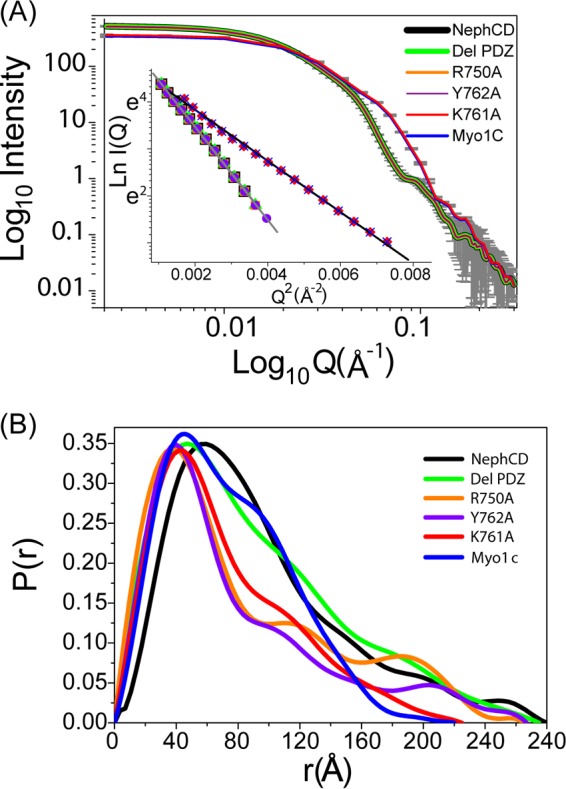
SAXS data of the Myo1c-Neph1 complex. (A) SAXS intensity profiles from unliganded Myo1c (diluted to same molar concentration) and an ∼1:1 molar mixture of Myo1c with different Neph1-CD. The Guinier analysis of the data sets presuming globular scattering shape is shown in the inset. (B) P(r) computed from the indirect Fourier transformation of the data sets.