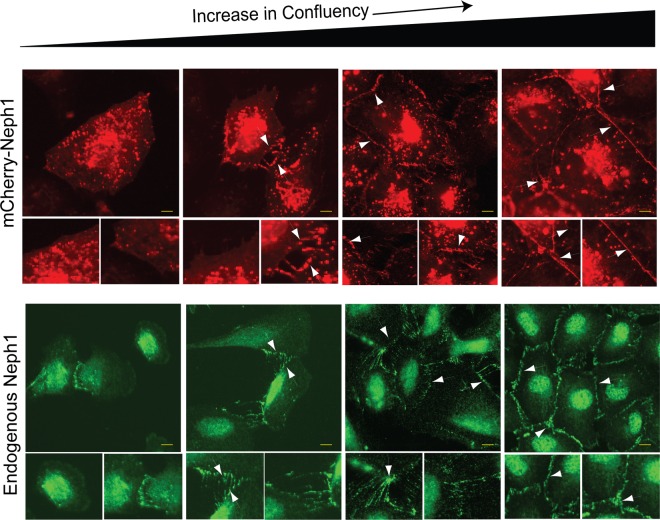
FIG 9.
Neph1 intracellular distribution changes with cellular confluency. Untransfected podocytes and mCherry-Neph1-wt-expressing podocytes were cultured at very low confluence (<20%) to full confluence levels (100%) and analyzed by immunofluorescence microscopy for endogenous Neph1 and mCherry Neph1 localization at different stages of confluence. The localization of mCherry Neph1 (top) changed in a fashion similar to endogenous Neph1 (bottom) from mostly intracellular at low confluence to cell-cell junctions at high confluence. Arrowheads indicate the localization of mCherry-Neph1-wt at the cell-cell junctions. Scale bars represent 10 μm.

