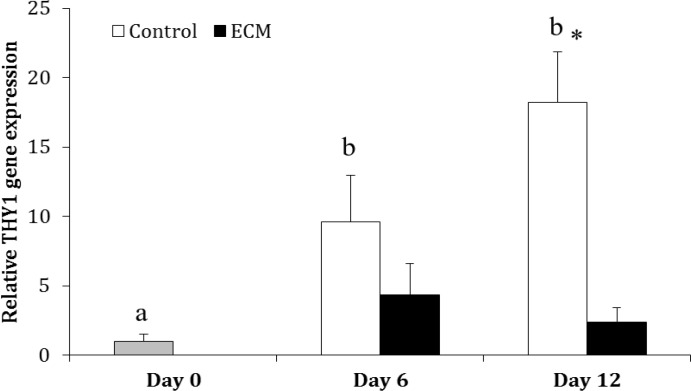
Fig. 1.
Relative gene expression of THY1 in the control and ECM groups (n = 3) on Days 0, 6 and 12.
ab Different letters indicate significant difference within groups between different time-points (p < 0.05). Asterisk indicates significant difference between two experimental groups at the specified time-point (p < 0.05).

