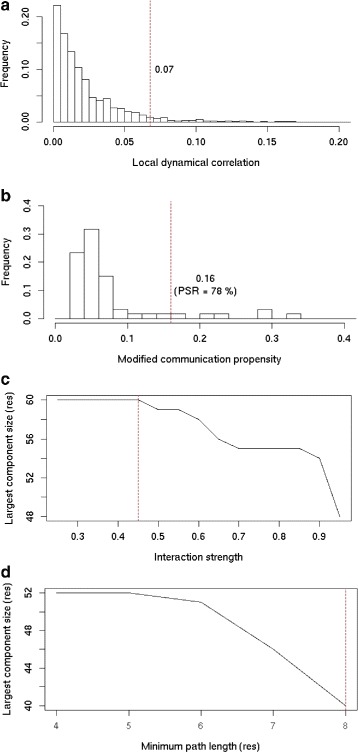
Fig. 2.

Parameters for protein A. a Distribution of the local dynamical correlation (C o r r LFA) values. b Distribution of the communication propensity (CP) values. c Size of the largest connected component (in residues) extracted from the adjacency graph constructed based on non-covalent interaction strengths. d Size of the largest connected component (in residues) extracted from the PCN by considering communication pathways with different minimum lengths
