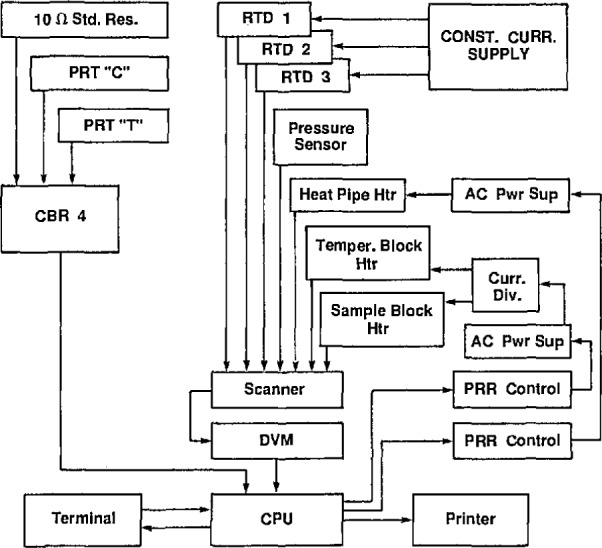
Figure 15.

Schematic drawing showing the use of a laboratory microcomputer in acquiring resistance and voltage data and providing control information for dilatometry. The central processing unit, CPU, was programmed to obtain resistance data, using digital bridge CBR4 [32], from a 10-Ω thermostated standard resistor; from a control thermometer, C; and from the sample thermometer, T. The CPU converted those data to temperature values for use in control and evaluation. Through a low-thermal scanner, a digital voltmeter, DVM, provided data from three temperature sensors (RTDs), from a digital pressure sensor, and from various heaters. A portion of the operational program was used to send digital signals to temperature controllers of the proportional-rate-reset type; these, in turn, operated ac power supplies that activated heaters either directly or through current-divider circuits. The CPU also provided out-puts to a terminal and to a printer.
