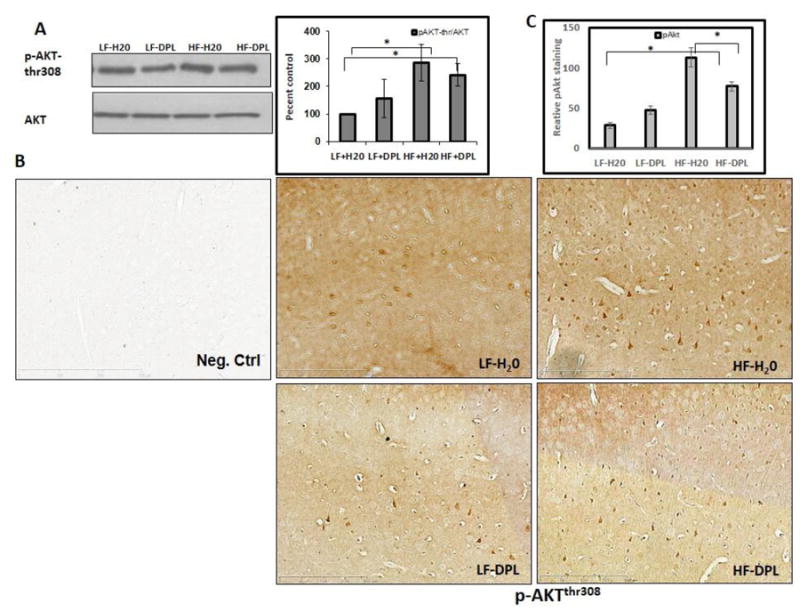
Fig.8. Effects of diet and donepezil on phospho-Aktthr308 levels in the brain.

(A) Akt levels were analyzed using western blotting (η=5) as well as (B) immunohistochemical staining (η=4). Mice group on low fat diet and water were taken as control. . (D) Statistical analysis of pmTOR staining in IHC (20X) images (η=4) *p<0.05, when compared with control group. HF: high fat diet; LF: low fat diet; DPL: donepezil.
