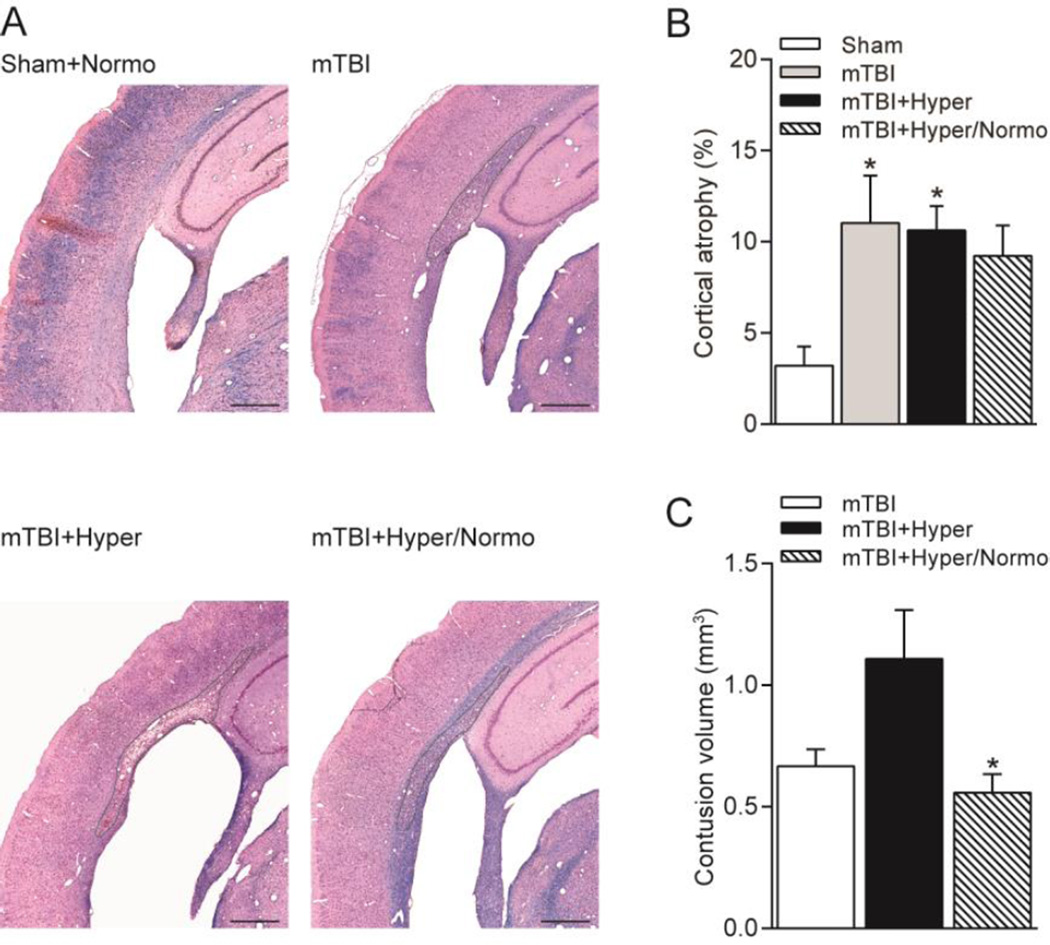
Fig. 4.
Histopathological analysis after mTBI and hyperthermia. (A) Representative sections at bregma level −3.8 mm stained with H&E and Luxol fast blue. Lines demarcate the contusional areas. Scale bars 500 µm. (B) Cortical atrophy was present in all mTBI groups and significantly increased from sham animals. (C) Contusions in the external capsule between the parietal cortex and hippocampus were observed in all mTBI animal groups. Contusion volume was significantly less in cooled hyperthermic mTBI animals as compared to hyperthermic mTBI animals. *p<0.05, one-way ANVOA and Tukey’s post-hoc analysis. n=11 sham animals, n=11 normothermic mTBI animals, n=11 hyperthermic mTBI animals, n=12 hyperthermic/normothermic mTBI animals.

