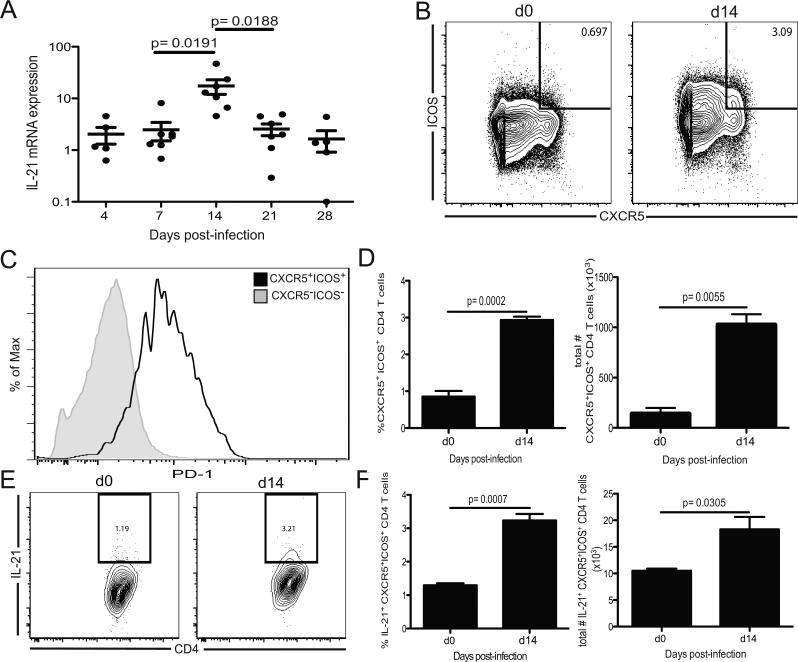
Figure 1. IL-21 production during E. cuniculi infection.
A) IL-21 mRNA expression was assessed by real time PCR in the spleen of C57B/6 mice at different time points post infection. Data represent two experiments with 3-4 mice per time point. B) Splenic CXCR5+ICOS+ CD4 T cells were analyzed at day 14 p.i. Plots are gated on CD4 T cells. C) Histogram illustrates PD-1 expression from CXCR5+ICOS+ and CXCR5−ICOS− CD4 T cells at day 14 p.i. D) Graph represents the total number of splenic CXCR5+ICOS+ CD4 T cells per mouse at the same time point. E) IL-21 expression by CXCR5+ICOS+ CD4 T cell subset was measured by intracellular staining. Plots are gated on CXCR5+ICOS+ CD4 T cells at day 0 and 14 p.i. F) Graph represents the frequency and total numbers of IL-21 producing CXCR5+ICOS+ CD4 T cells. Results (B-F) are representative of at least two independent experiments.

