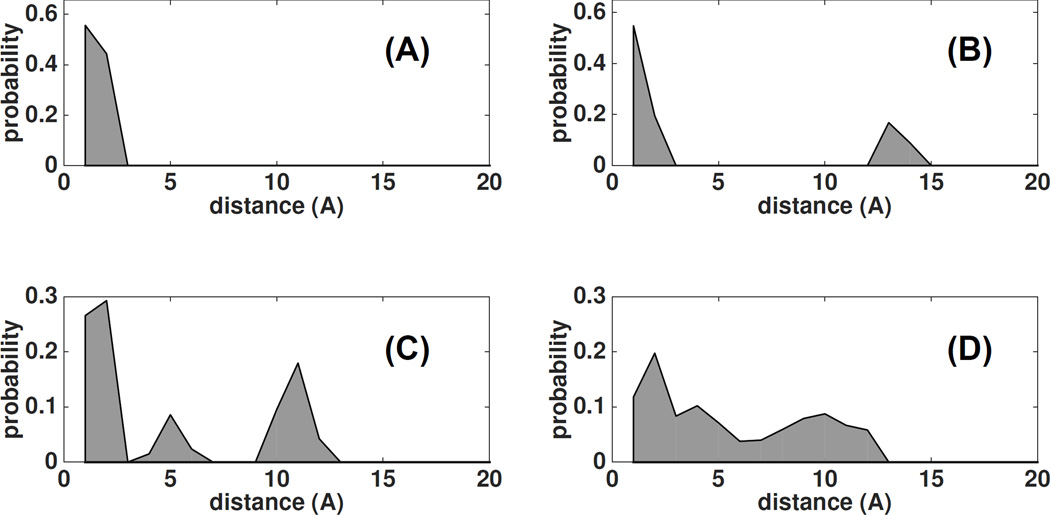
Figure 10.
The self-distance distribution of the labels at different sites/proteins: (A) narrow distribution, (B) two rotamer populations separated by 13 Å; (C) three peaks corresponding to tripartite population, forming an isosceles triangle of 12 and 5 Å ; (D) a broad distribution with the spread of 12 Å.

