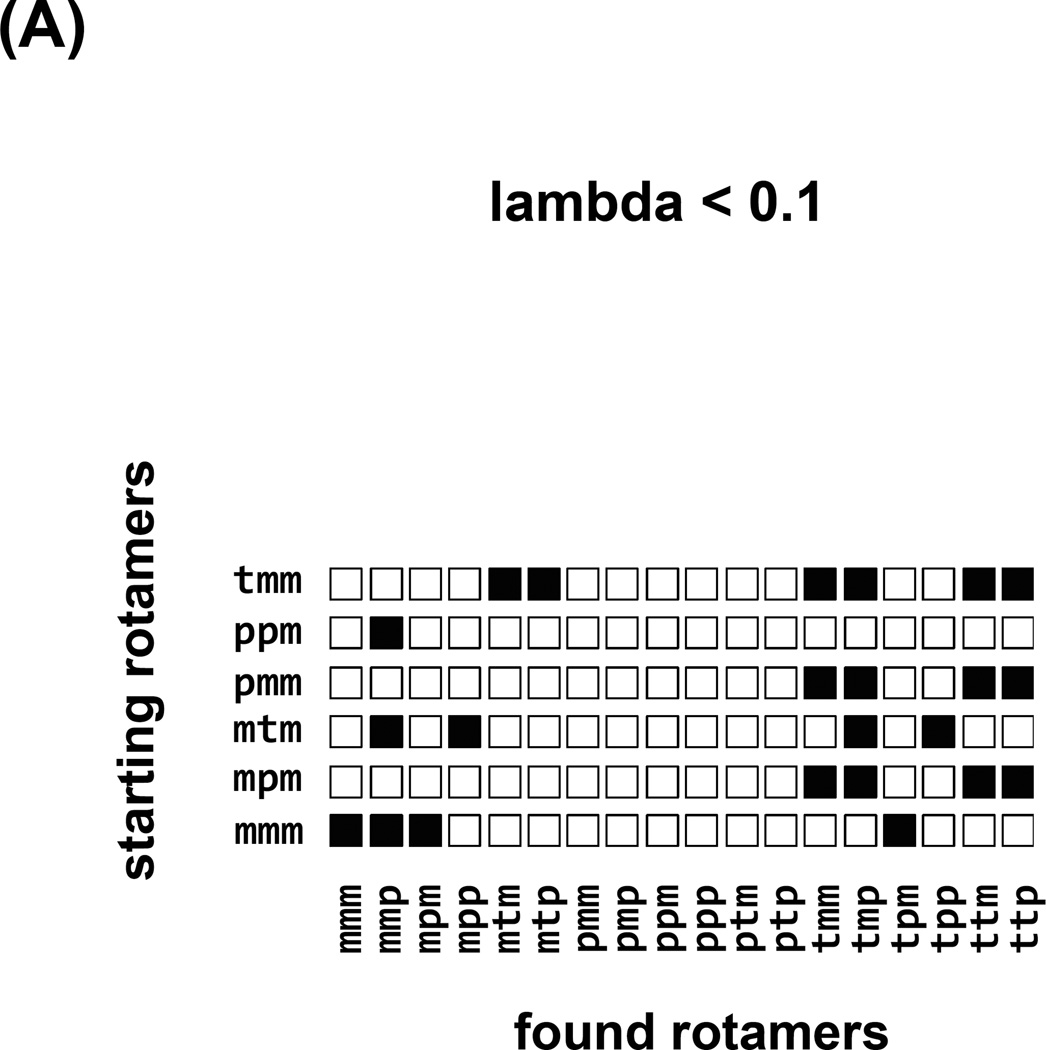
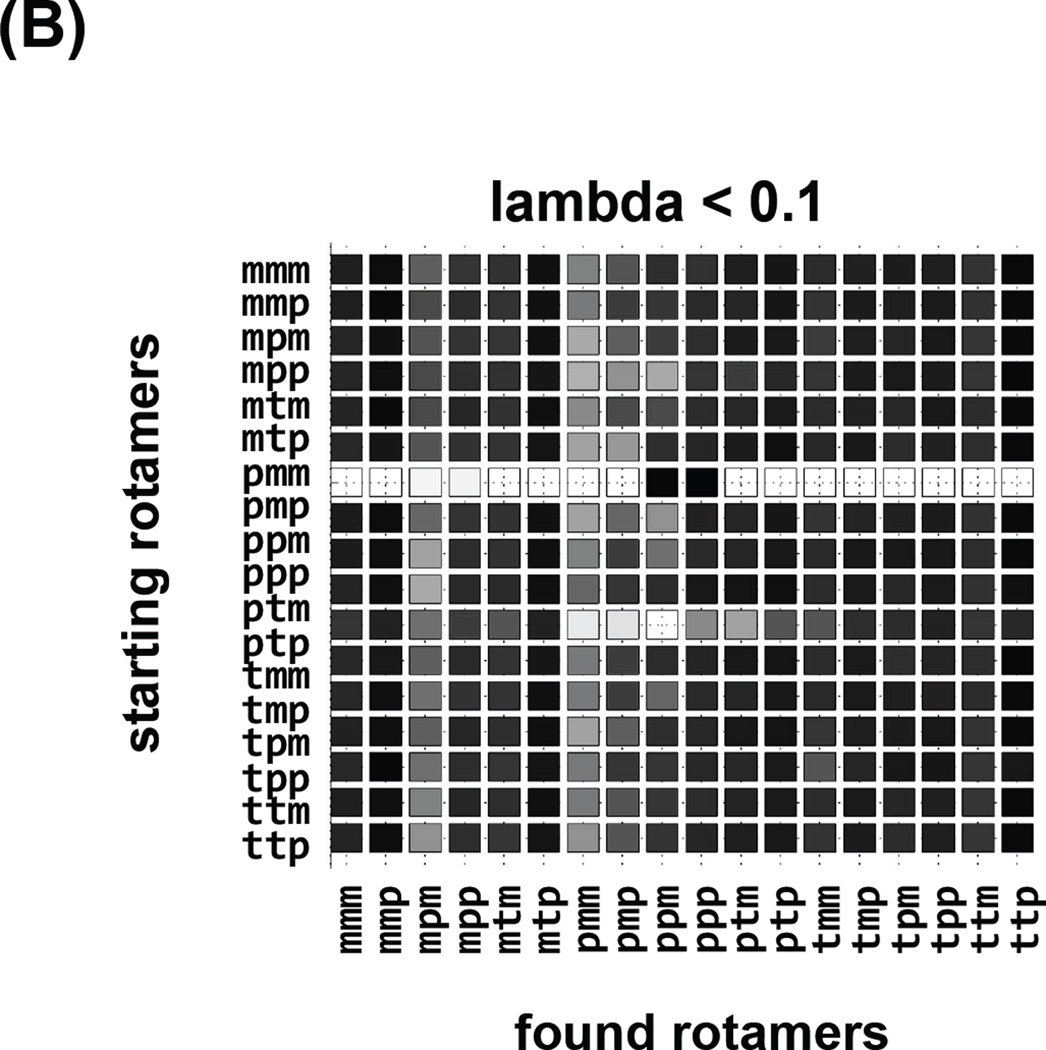
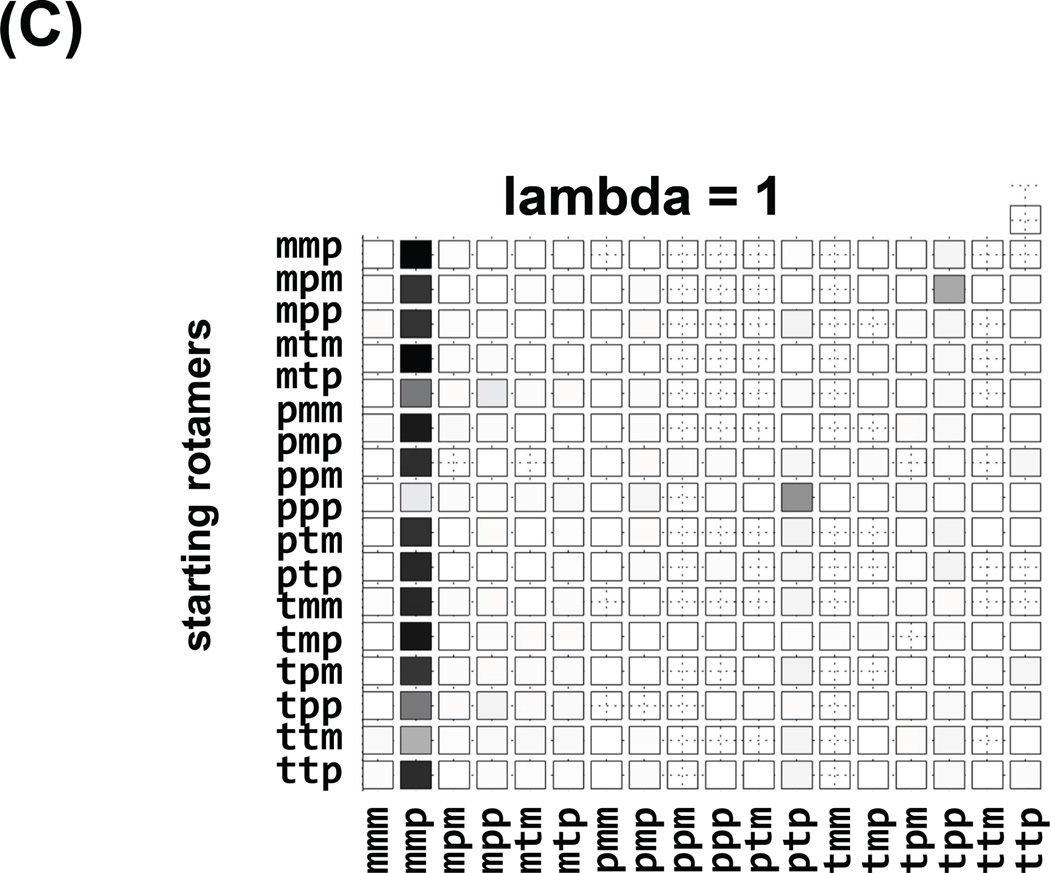
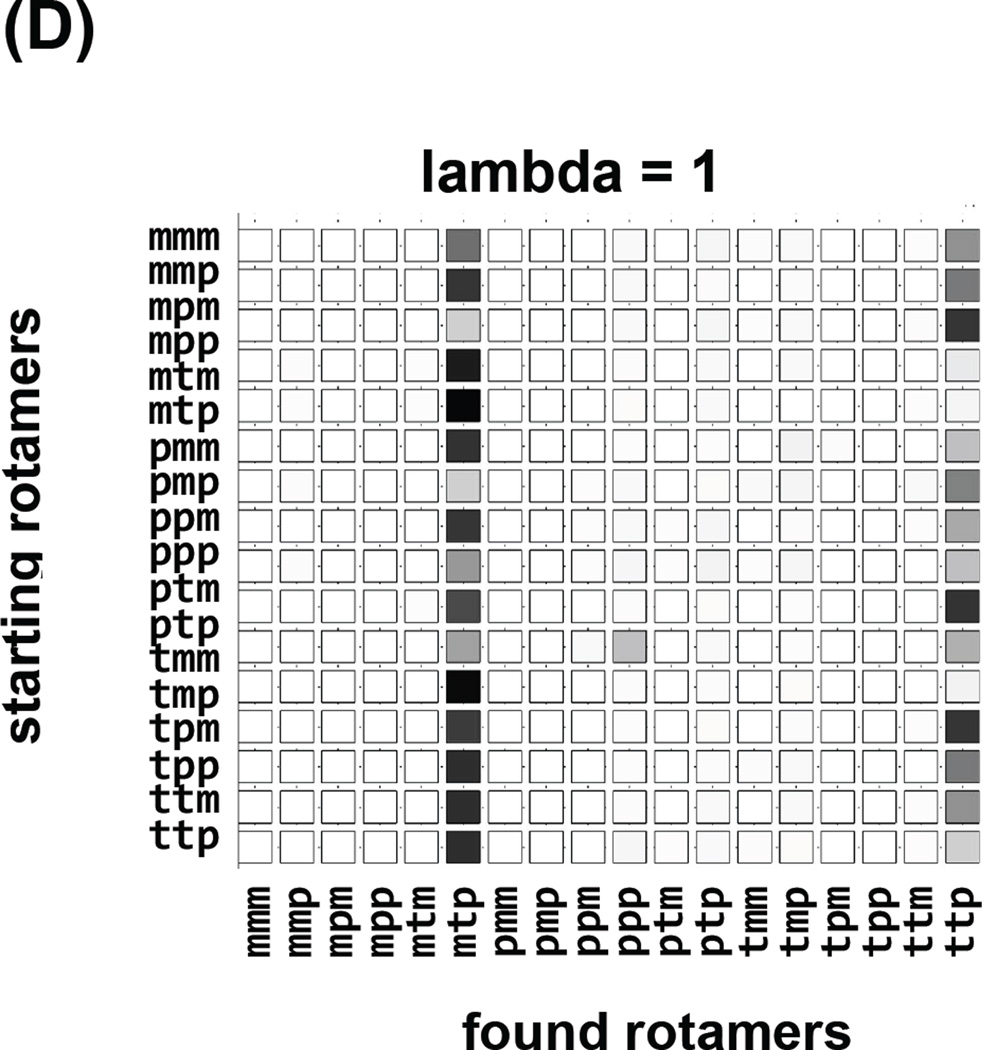
Figure 7.
Robustness of the strategy, where each row corresponds to an independent SS trajectory starting with a different rotamer identified on the left. Columns correspond to the conformations observed in each trajectory. In (A) the “visited” states for regular MD trajectories are shown, a fraction of available rotamer conformations was covered and the influence of the starting conditions on the sampling can be seen. In (B) the “visited” states for SS trajectories are shown, and although the majority of them show similar sampling the trajectory starting with pmm only visits two rotamers, indicating that the trajectory was stuck in a local minimum and it should not be taken into account. In (C) and (D) the “free energy” checker boards of the rotamers observed at lambda =1 when the forcefield is fully are shown for two different spin label sites. In (C) the mmp rotamer was prevalent 17 times out of 18 different trajectories. In (D) two rotamers were prevalent: mtp and ttp.


