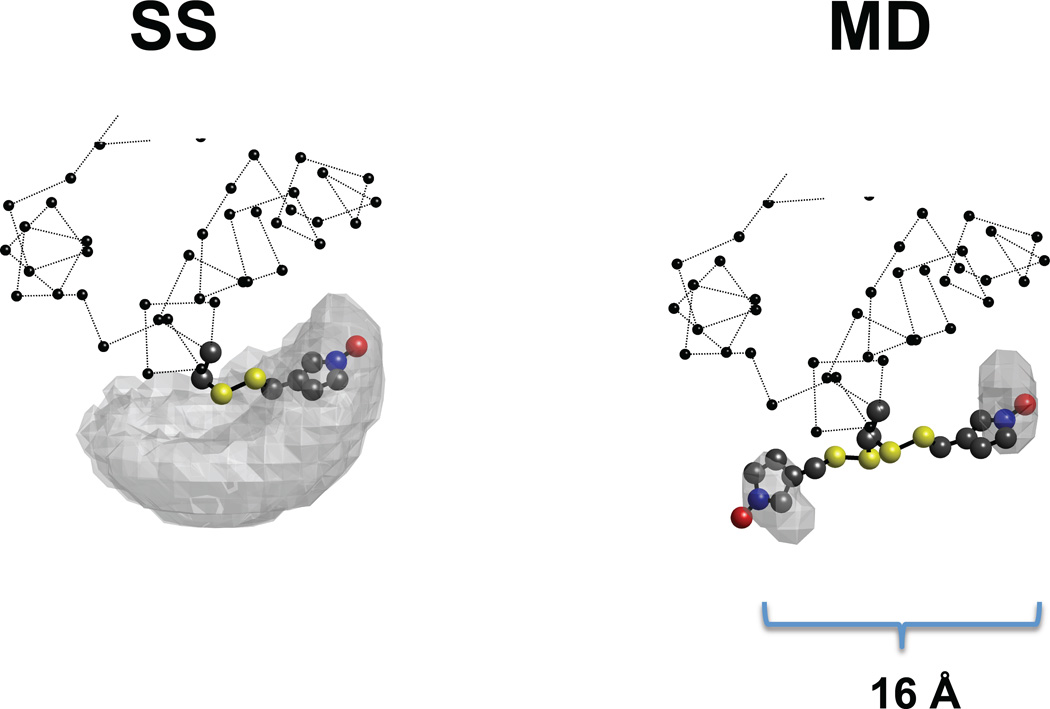
Figure 8.
Molecular representation of the SS (left) and MD (right) trajectories. The balls-stick representation shows the spin label, the gray surface depicts the space sampled by the N atom of the nitroxide, and the balls and dotted line depict the protein backbone. The results of two different trajectories (starting from mmm and ppm) for SS and MD each are shown. In the case of simulated scaling the sampled surface is independent of the starting point, and the most prevalent conformation is the same for both trajectories. In molecular dynamics simulation of equal length (10 ns) the label sampled a small fraction of the space around the starting point. The distance between the NO of the two conformations found in MD was 16 Å.

