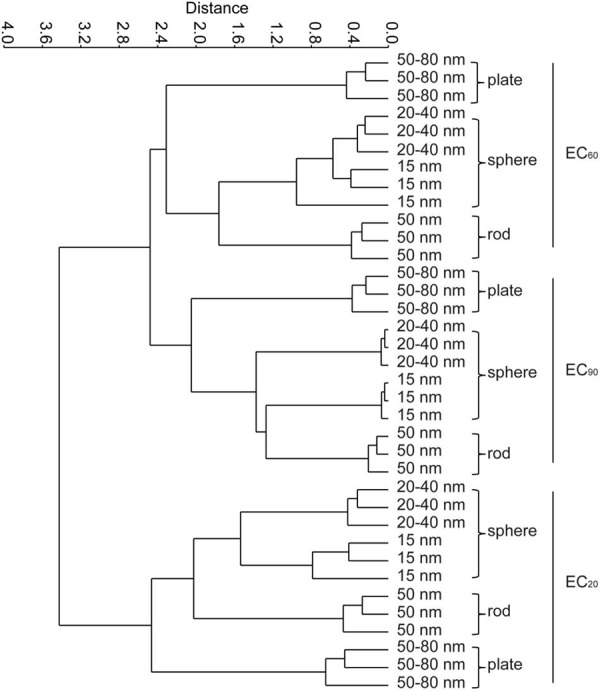
FIGURE 4.

Classifications of four different AgNPs treatments by cluster analysis according to the metabolic characteristics of the microbial communities at the EC20, EC60, and EC90 levels. Two-way ANOSIM, Euclidean-based similarity, n = 3, EC level R = 0.953, p = 0.0001; shape R = 0.876, p = 0.0001, respectively.
