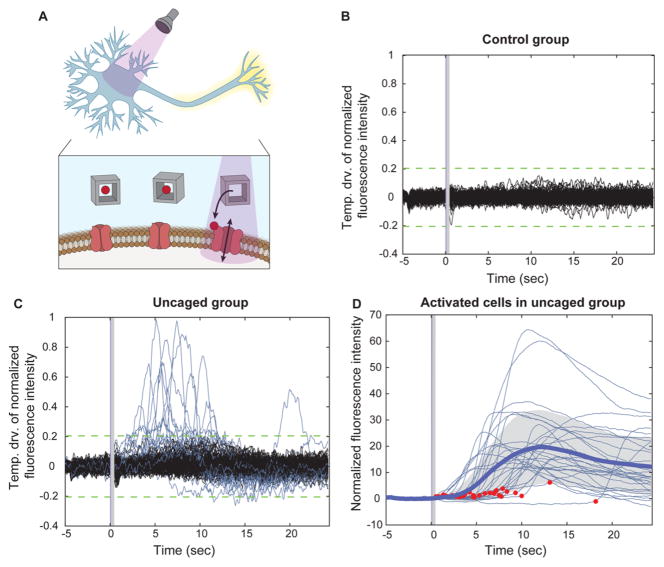
Figure 4.
Light-triggered release of glutamate from DNA nanocages. (A) Schematic depiction of glutamate release from DNA nanocage using UV light at 240–400 nm and the subsequent activation of neurons by the freed glutamate. (B,C) Temporal derivative of the normalized fluorescence intensity indicating calcium concentration changes in the control group, neurons illuminated in the absence of nanocages (B, N = 124 neurons), and in the uncaging group, neurons illuminated in the presence of nanocages (C, N = 185 neurons). (D) Normalized fluorescence intensity indicating intracellular calcium activities of responsive cells in the uncaged group, aligned to light onset. Thick blue line indicates the mean, shaded gray indicates standard deviation, and red dots indicate the onset time (N = 30 neurons).

