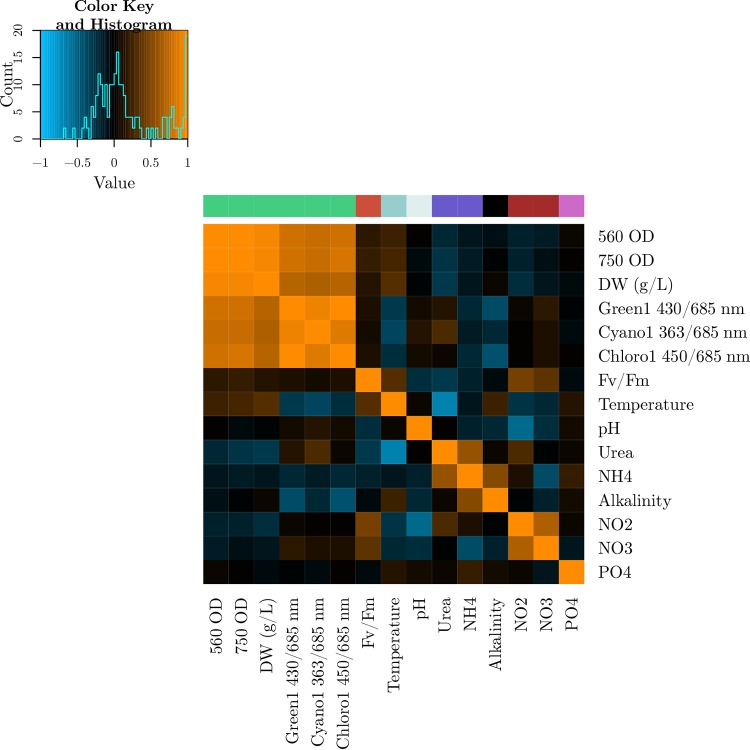
FIG 4.
Correlation matrix of all phenotypic variables: Ecosystem variables forming a clique using the CAST algorithm are represented with a single color in the color bar, as also suggested by the orange correlation blocks in the matrix. Cell colors are based on the Pearson correlation coefficients according to the given color map.

