
FIG 6.
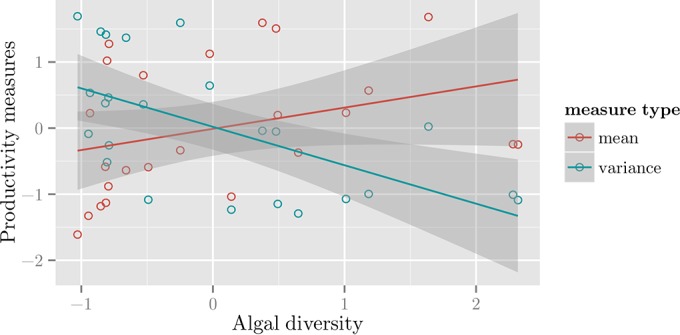
Correlations of the productivity mean and standard deviation versus algal diversity. The scatter plot shows the correlations between algal diversity versus the mean and standard deviation of productivity measurements centered around genomic sampling days for 2 h = 8 weeks (see Materials and Methods) using the regression lines. Algal diversity is positively correlated with mean productivity (Pearson R = 0.33, P = 1.1 × 10⁻¹) and negatively correlated with standard deviation in productivity (Pearson R = −0.6, P = 1.9 × 10⁻³).