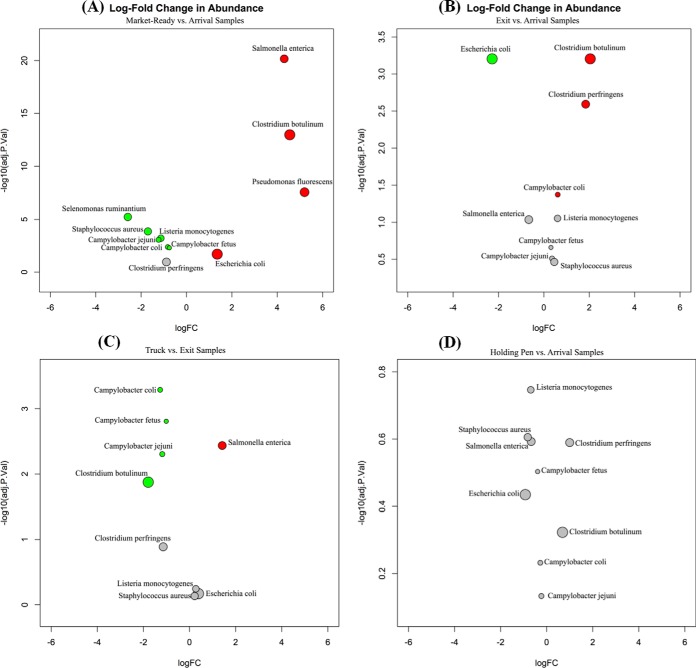
FIG 2.
(A to D) Pairwise comparison of log fold change (logFC) of normalized counts of investigated pathogens and nonpathogens between market-ready and arrival samples (A), exit and arrival samples (B), truck and exit samples (C), and holding pen and arrival samples (D). Red circles indicate a significant (adjusted P value [adj.P.Val] < 0.05) increase in normalized counts of bacterial species in samples collected at a former site/time, and green circles illustrate a significant (adjusted P < 0.05) decrease in normalized counts of bacterial species in samples collected at a former site/time within comparisons. Gray circles indicate that the change between samples collected at different sites was not significant. The size of the circles is proportional to average normalized counts of corresponding bacterial species across all samples.

