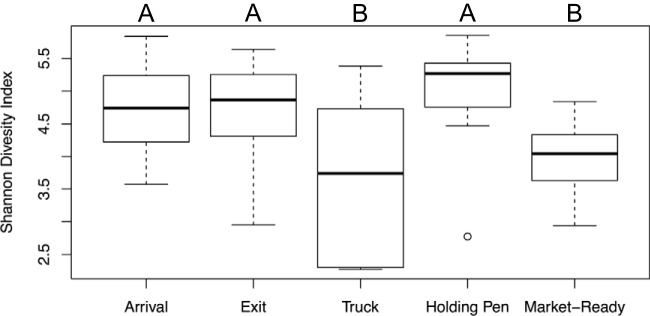
FIG 4.
Box plot of Shannon's diversity index for samples collected at different sites/times (arrival, n = 24; exit, n = 24; truck, n = 8; holding pen, n = 15; and market-ready samples, n = 16). Different letters (A and B) indicate that the least-squares means of Shannon's diversity index differed among samples collected at different sites/times (P < 0.05). The circle indicates an outlier.

