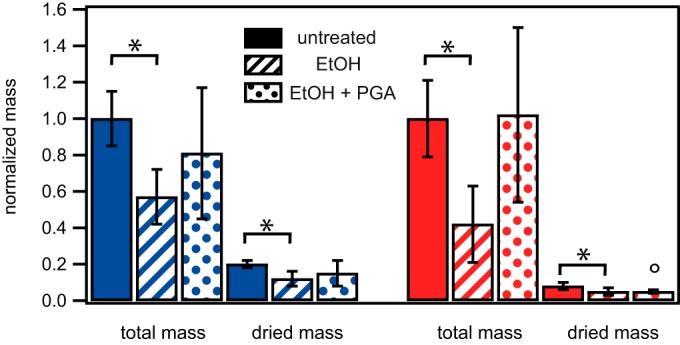
FIG 5.

Comparison of normalized total and dry masses of biofilms formed by the wild-type strains NCIB 3610 and B-1. This bar plot shows the total produced masses of 1-day-old biofilms of the wild-type strains NCIB 3610 (blue) and B-1 (red), as well as the dry masses of biofilms of these two wild-type strains, as determined by lyophilization (see Materials and Methods). Biofilms were not treated, were treated with ethanol (EtOH) for 60 min, or were grown in the presence of γ-PGA and then treated with ethanol for 60 min, as indicated. The circle indicates that under these particular conditions, a subset of samples could not be successfully lyophilized, indicating that ethanol might be taken up into the B-1 biofilm. The data given here represent the dry weights of the samples for which lyophilization was successful. Error bars denote the standard deviations. P values for these data are given in Table S4 in the supplemental material. P values below 0.05 indicate that the data obtained in the presence of ethanol were significantly different from those obtained in the absence of ethanol for that strain and are indicated with an asterisk.
