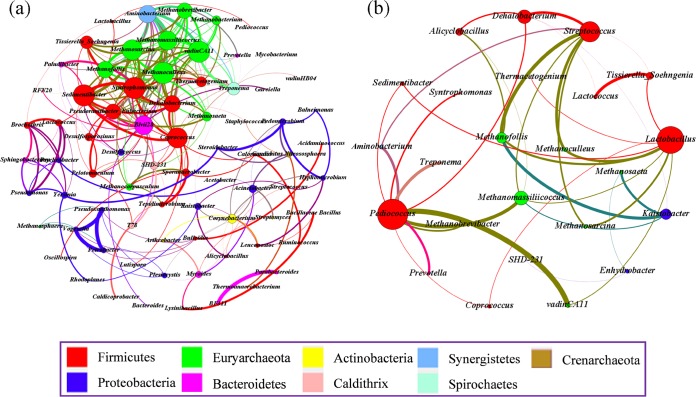
FIG 4.
Networks of cooccurring microbial genera in FPM samples based on correlation analysis. A connection indicates a statistically significant (P < 0.01) strongly positive correlation (a) (Spearman's ρ > 0.6) or a negative correlation (b) (Spearman's ρ < −0.6). For each panel, the size of each node is proportional to the number of connections, the nodes of the same color were affiliated with the same phylum, and the thickness of each connection between two nodes is proportional to the value of Spearman's correlation coefficients of >0.6 or <−0.6.

