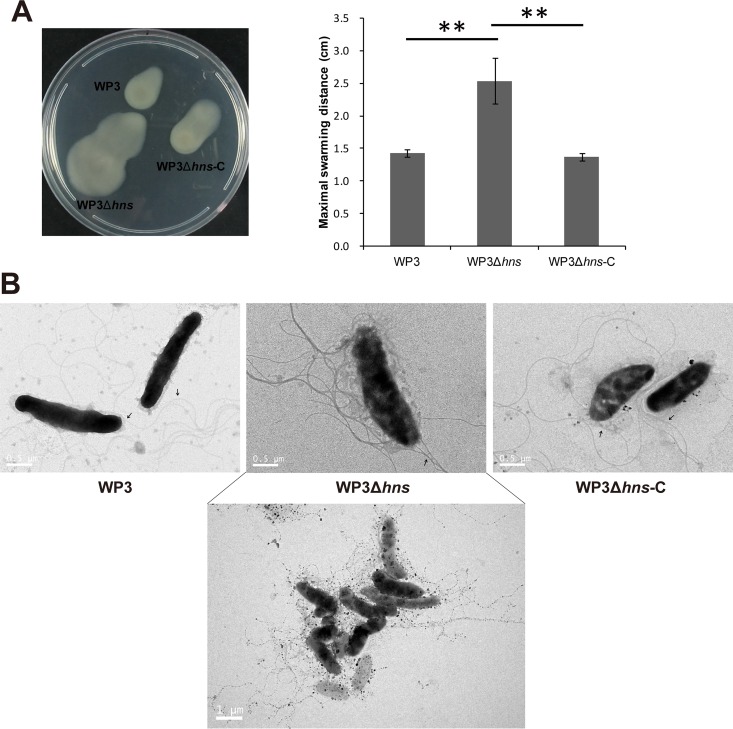
FIG 3.
Influence of H-NS on swarming motility and flagellar production of WP3. (A) Swarming motility assays of the hns gene mutant and complemented strain. The data shown represent at least three independent experiments, and the error bars indicate the standard deviations. The data were analyzed by Student's t test; **, P < 0.01. (B) Transmission electron microscopic observation of WP3Δhns swarming cells that were cultured on swarming agar plates. The arrows indicate the polar flagellum, and scale bars are shown at the bottom left.

