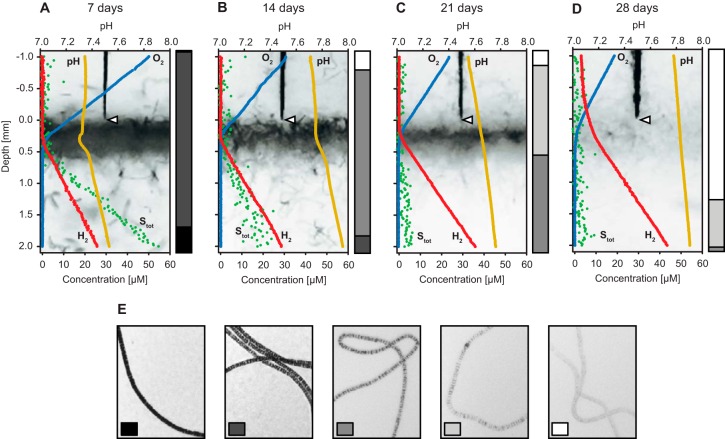
FIG 3.
Development of chemical gradients and sulfur inclusion density in hydrogen-supplemented Beggiatoa sp. 35Flor cultures over 4 weeks. The cultures were grown in the presence of a low sulfide flux. (A to D) Microsensor profiles were recorded 7, 14, 21, and 28 days after inoculation. Profiles of oxygen (blue), hydrogen (red), pH (orange), and total sulfide (Stot; green) were determined at a vertical resolution of 20 μm. Photographs of the profiled mat sections are shown in the background. For each set of profiles, the tip of the microsensor (triangle) indicates the zero position at the mat surface to which all sensors were aligned. The bar graph next to each set of profiles shows a semiquantitative estimation of the relative sulfur inclusion density in Beggiatoa filaments at that point of time. This estimation considered five degrees of sulfur inclusion density, examples of which are shown in panel E. The standard deviation of sulfur inclusion density estimates in triplicate cultures was consistently below 10%. The density of sulfur inclusions decreased over time, resulting in an increasingly transparent appearance of the Beggiatoa mat.

