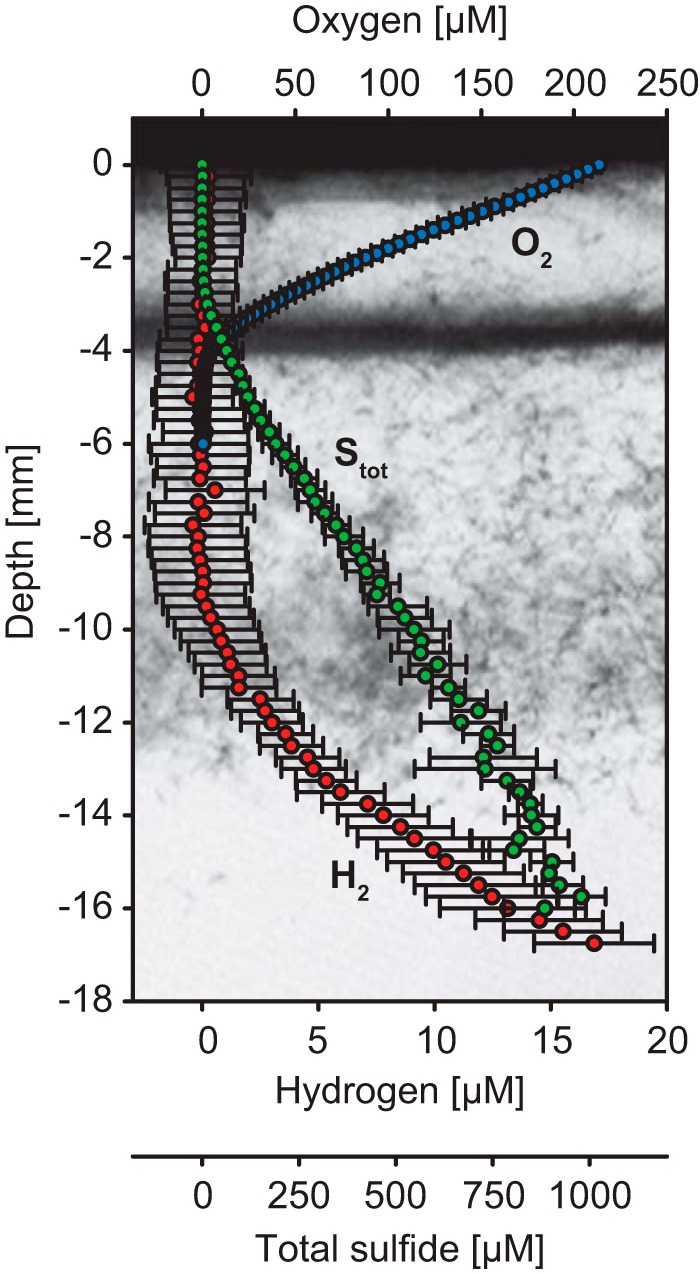
FIG 6.

Hydrogen consumption under anoxic conditions in Beggiatoa sp. 35Flor cultures with a high sulfide flux. Oxygen (blue), hydrogen (red), and total sulfide (Stot; green) profiles were measured in hydrogen-supplemented cultures with vertical resolutions of 100 μm (O2) and 250 μm (H2, Stot). The plotted values are averages (± standard deviation) of measurements performed in three parallel cultures. The photograph in the background shows the filament distribution in a representative culture after 9 days of incubation when the profiles were measured. Depth values represent depth below the air-ager interface.
