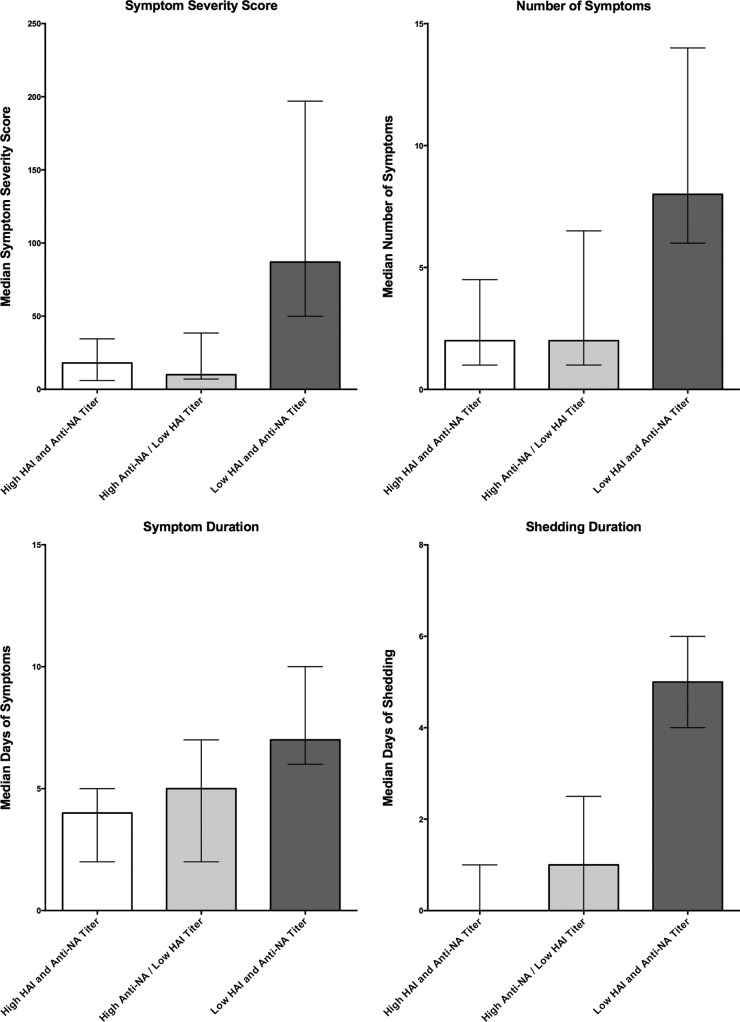
FIG 5 .
Disease severity measures in participants grouped by combinations of HAI and NAI titers. Participants were placed into three groups, those with HAI titers and NAI titers of ≥1:40 (high HAI and NAI titers; n = 25), those with HAI titers of <1:40 but with NAI titers of ≥1:40 (high NAI/low HAI titers; n = 11), and those with HAI and NAI titers of <1:40 (low HAI and NAI titers; n = 29). There were no individuals with low NAI and high HAI titers at baseline. For each disease metric, bars represent the median values, and error bars represent the interquartile ranges.

