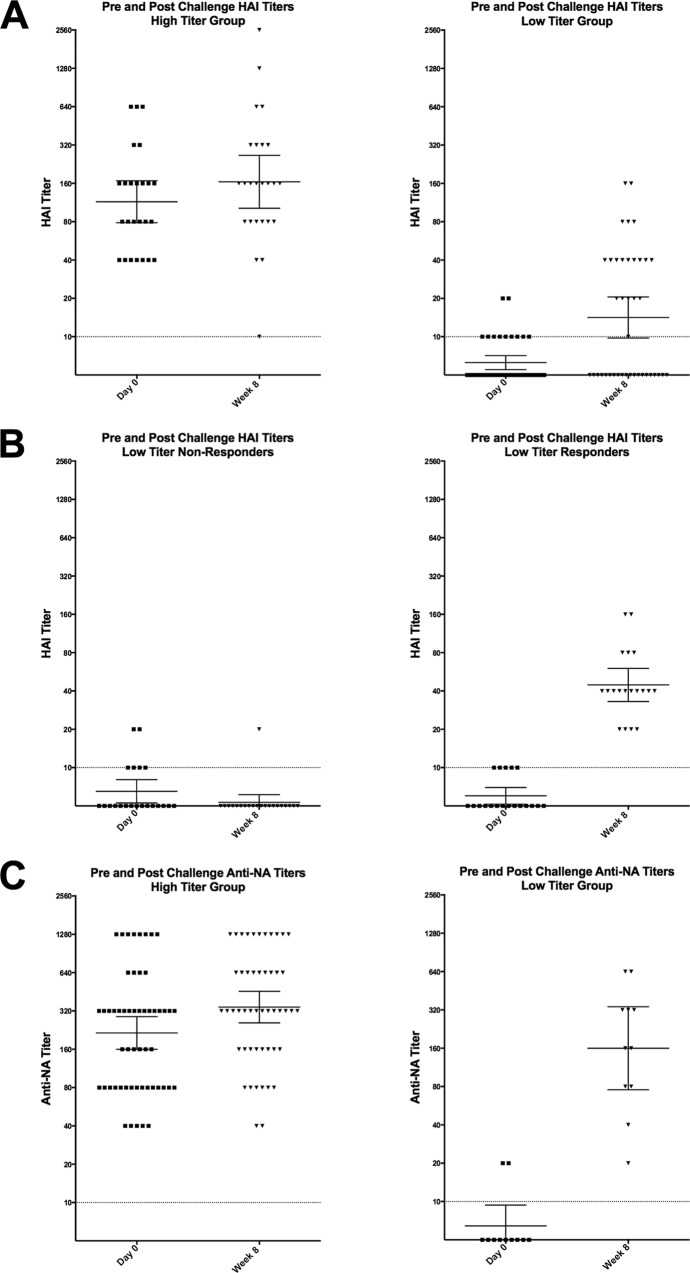
FIG 7 .
HAI and NAI titer responses postchallenge. (A) HAI titer on day 0 (prechallenge) and week 8 (postchallenge) in the participants in the low- and high-HAI-titer groups. (B) Approximately 50% of those in the low-HAI-titer group demonstrated no significant HAI response postchallenge. (C) All participants with a low NAI titer prechallenge demonstrated a significant rise in NAI titer 8 weeks postchallenge. Each symbol represents the value for an individual participant. Horizontal lines represent geometric means with 95% confidence intervals indicated by the error bars. Dotted lines represent the lower limit of detection.

