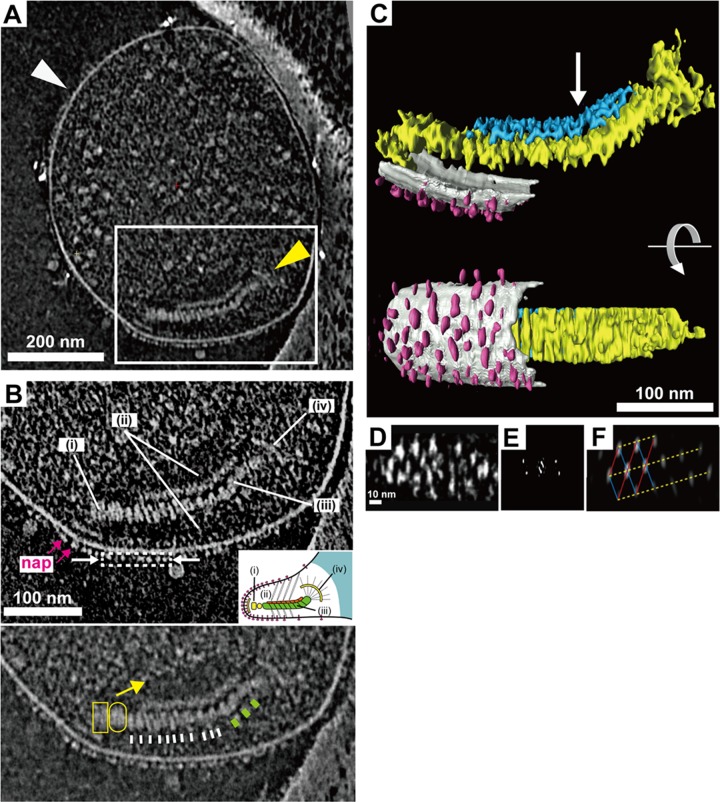
FIG 1 .
Attachment organelle image reconstituted from ECT. (A) Images of 15-nm-thick slices through the tomograms of wild-type cells. The attachment organelle can be observed in the white box. The whole cell was flattened in a thin film of ice. (B) Image of a 16-nm-thick slice through the tomogram of an attachment organelle. Top: the image shows a dense array of the knoblike particles on the membrane surface (nap) and the terminal button (i), translucent area (ii), paired plates (iii), and bowl (wheel) complex (iv). Inset: schematic diagram of the attachment organelle. Bottom: identical to the image above but at lower contrast. The outline of the translucent area is marked with a yellow arrow. The thick and thin striations of the thick plate are marked by white and green bars, respectively. The terminal button is marked by a box and an oval corresponding to those in the inset schematic (i). (C) Segmented three-dimensional image of the tomogram shown in panel A depicting the knoblike particles (pink), membranes (light gray), and thin (blue) and thick (yellow) plates of the internal core. The bend is marked with an arrow. The slices through the tomogram, the segmentation, and the rotation can be seen in Video S2 in the supplemental material. (D) Face-on view of the knoblike particles extracted from the boxed area indicated with the dashed line in panel B, with a slice thickness of 1.2 nm. (E) Fourier transform of the view in panel D. (F) Noise-filtered image of the view in panel D. The lattice lines (blue, red, and yellow) are indicated.

